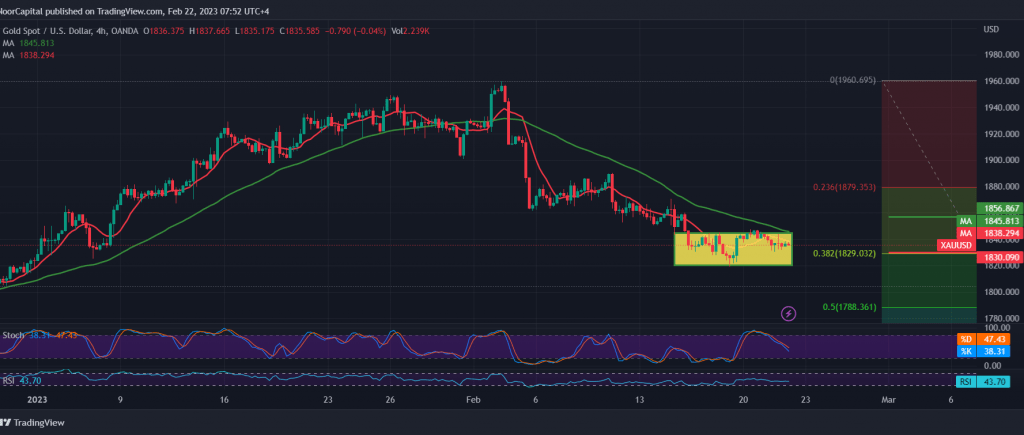
Gold prices did not witness noticeable movements during the previous trading session within a narrow price range between 1843 and 1830.
Technically, gold prices attempted to recover and compensate for part of their previous losses, recording a high of 1843. However, with a closer look at the 4-hour chart, we notice the continuation of the bullish momentum declining. This comes in conjunction with the loss of bullish momentum as shown on the stochastic indicator.
We tend to be negative, with intraday trading remaining below 1850, targeting 1828, Fibonacci retracement of 38.20%, as a first target, and breaking it facilitates the task required to visit 1821, and then 1805, the second official target for the current downward wave, and we must pay close attention during this week’s trading that price stability below 1805 opens the door to the third correction, 1787, a correction of 50.0%.
Only from the top, skipping upwards and rising above 1856 postpones the chances of a decline but does not cancel them, and we may witness a re-test of 1865 and 1878 before resuming the decline again.
Note: Today we are awaiting the “results of the Federal Reserve Committee meeting” and may witness high price fluctuations.
Note: Trading on CFDs involves risks. Therefore, all scenarios may be possible. This article is not a recommendation to buy or sell but rather an explanatory reading of the price movement on the chart.
| S1: |
 Noor Trends News, Technical Analysis, Educational Tools and Recommendations

