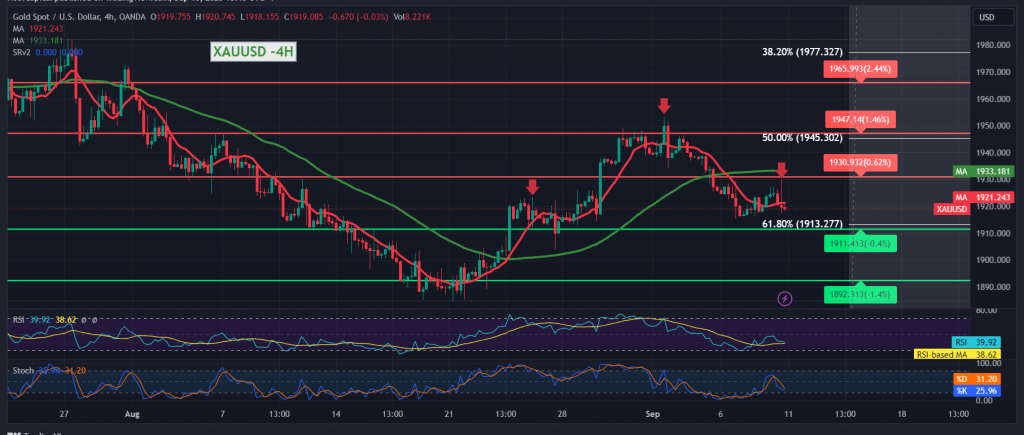
We adhered to intraday neutrality during the previous technical report due to conflicting technical signals, explaining that we are waiting for the confirmation of the breach of the 1929 resistance or the breach of the 1913 support.
Gold prices found strong resistance around 1929, which forced the price to trade negatively to end its weekly dealings around 1919; by looking at the 240-minute interval chart, we find the 50-day simple moving average that constitutes an obstacle in front of the price and is stimulated by the negative signals coming from the relative strength index on the short time intervals.
Although we tend to be negative, we prefer to witness the breaking of the main support floor of the current trading levels 1913, Fibonacci retracement of 61.80%, which facilitates the task of reaching the target of 1908 and 1900, respectively, and the losses may extend later to visit 1895.
Only from the top, if the price succeeds in consolidating above 1913 and returning to stability above the 1929 resistance, that is a sign that the price will head towards 1935, and then 1945 50.0% correction for the next stations.
Note: Trading on CFDs involves risks. Therefore, all scenarios may be possible. This article is not a recommendation to buy or sell but rather an explanatory reading of the price movement on the chart.
| S1: |
 Noor Trends News, Technical Analysis, Educational Tools and Recommendations

