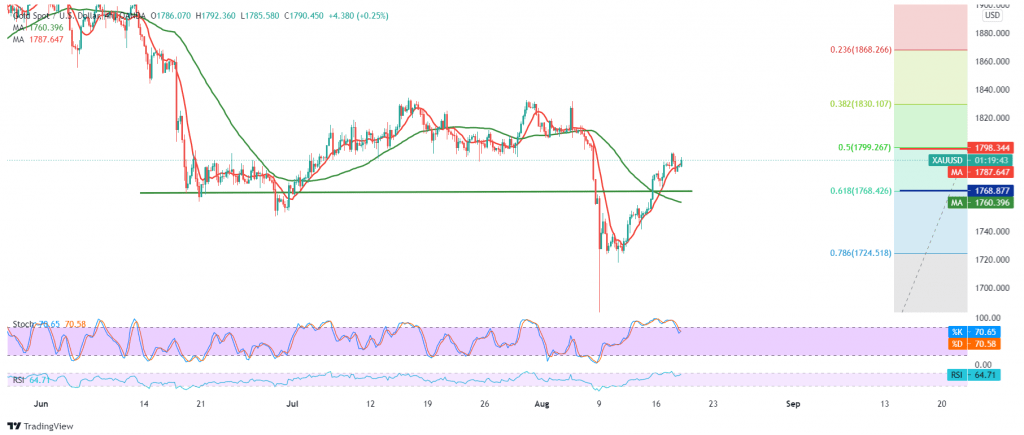
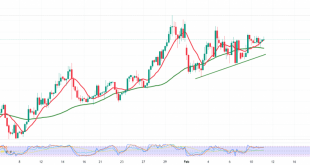
Gold prices managed to touch the first target required to be achieved during the previous analysis, which is located at 1794, recording its highest level at 1795 and approaching the official target by a few points at 1799.
On the technical side today, and with careful consideration on the 4-hour chart, we find the 50-day moving average that supports the bullish price curve, and this comes in conjunction with the RSI’s continued defense of the bullish trend.
On the other hand, we find some of the negative features that started to appear on stochastic, which might put the price under temporary negative pressure on the short intervals to retest 1780/1775 before rising again.
Note: The possibility of retesting 1780/1775 does not contradict the daily bullish trend, knowing that the official target is around 1799, the 50.0% Fibonacci correction, and its breach is a catalyst that extends the gains to visit 1810/1811.
In general, we continue to suggest the bullish trend as long as prices are stable above 1768, 61.80% Fibonacci correction. However, it should also be noted that the price stability below the mentioned level will stop the bullish trend immediately and put the price under strong negative pressure; its initial target is 1758.
| S1: 1780.00 | R1: 1799.00 |
| S2: 1775.00 | R2: 1803.00 |
| S3: 1768.00 | R3: 1811.00 |
 Noor Trends News, Technical Analysis, Educational Tools and Recommendations

