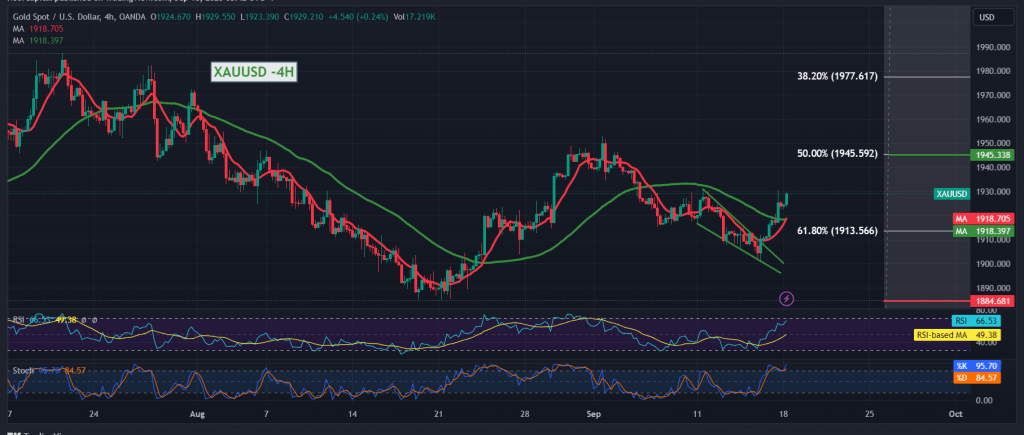
After several sessions of successive decline, gold prices concluded trading last week as part of attempts for a limited rise to retest the 1930 resistance level, and current movements are witnessing stability around the aforementioned level.
Technically, today gold prices are witnessing attempts to establish a good support floor around 1913, the support represented by the 61.80% Fibonacci retracement, as shown on the chart, and we find the simple moving average supports the possibility of a rise during today’s trading session, accompanied by signs of upward momentum.
Therefore, there is a possibility of an increase provided that we witness consolidation and stability of the price above 1930, and that is a motivating factor that enhances the chances of visiting 1936 and then 1945, the 50.0% Fibonacci retracement is an awaited target.
The return of trading stability below 1913 can thwart attempts to rise and lead gold prices to complete the official downward path with a target of 1900.
Note: The Stochastic indicator is trying to eliminate the current negativity and we may witness some fluctuation before obtaining the above-mentioned trend.
Note: Trading on CFDs involves risks. Therefore, all scenarios may be possible. This article is not a recommendation to buy or sell but rather an explanatory reading of the price movement on the chart.
| S1: |
 Noor Trends News, Technical Analysis, Educational Tools and Recommendations

