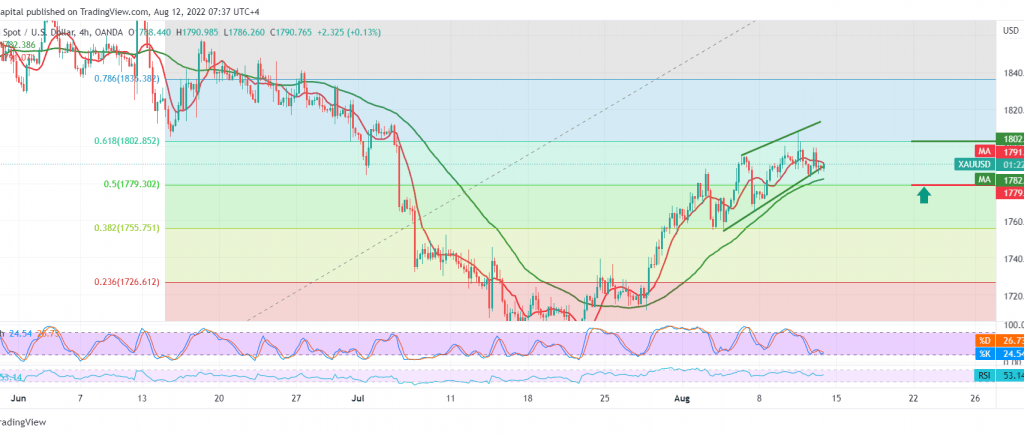
The technical outlook is unchanged, and there was no change in the gold’s movements, maintaining positive stability within the gradual bullish slope, recording its highest level around the psychological barrier of $1800 per ounce.
Technically, and carefully looking at the 4-hour chart, we notice the price stability above the 50-day simple moving average, as we find gold stable above the previously breached resistance, which is now turned to the 1779 support level represented by the 50.0% Fibonacci correction.
We tend to continue rising, targeting 1802 61.80% correction, considering that cohesion and stability above the mentioned level can strengthen gold’s gains towards 1808 and 1816 respectively, as long as prices remain stable above 1779.
Note: The clear negativity on the 14-day momentum indicator may force gold to initially provide some negative moves to retest 1782 before resuming the rise.
Note: Trading on CFDs involves risks. Therefore, all scenarios may be possible. This article is not a recommendation to buy or sell but rather an explanatory reading of the price movement on the chart.
| S1: |
 Noor Trends News, Technical Analysis, Educational Tools and Recommendations

