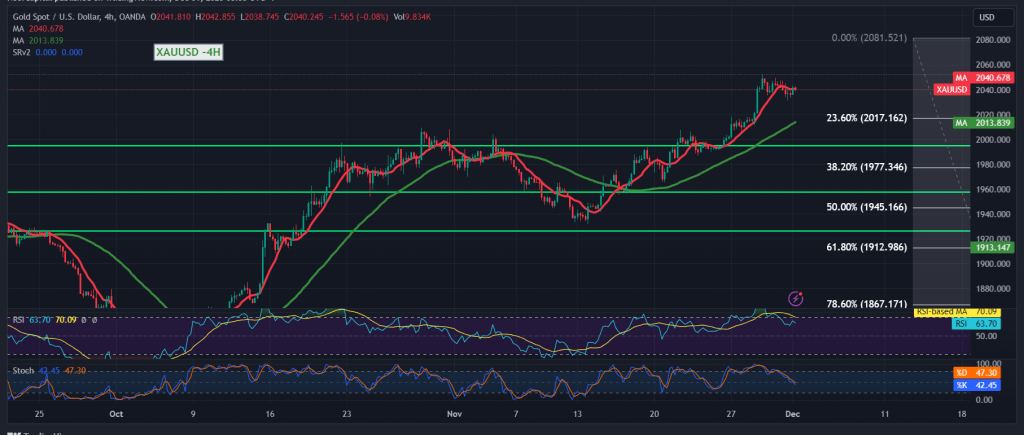
The support level mentioned in the previous technical report, situated at $2036, effectively restrained the downward movement in gold prices during the last trading session.
In terms of technical analysis today, examining the 240-minute time frame chart reveals that the price is currently holding above $2031, with the Stochastic indicator showing signs of a potential positive crossover, supporting the likelihood of an upward move.
Therefore, as long as intraday trading remains stable above $2031 and, more broadly, above the robust support at $2029, there is a positive outlook. Breaking through $2047 would facilitate a visit to the first target at $2052, followed by $2063 as the next milestone. Further targets may extend towards $2070.
It’s important to note that a close below $2029 in the hourly candle could negate the bullish scenario, leading gold prices to trade negatively. In such a scenario, the aim would be to retest $2023 and $2015, potentially extending towards $2009 before attempting another rise.
Warning: High-impact economic data is expected from the American economy today, including the Manufacturing Purchasing Managers’ Index issued by the ISM and a press talk by the Chairman of the Federal Reserve. Consequently, there may be high price volatility at the time of news release.
Warning: The level of risk is elevated amid ongoing geopolitical tensions, and there may be high price volatility.
Note: Trading on CFDs involves risks. Therefore, all scenarios may be possible. This article is not a recommendation to buy or sell but rather an explanatory reading of the price movement on the chart.
| S1: |
 Noor Trends News, Technical Analysis, Educational Tools and Recommendations

