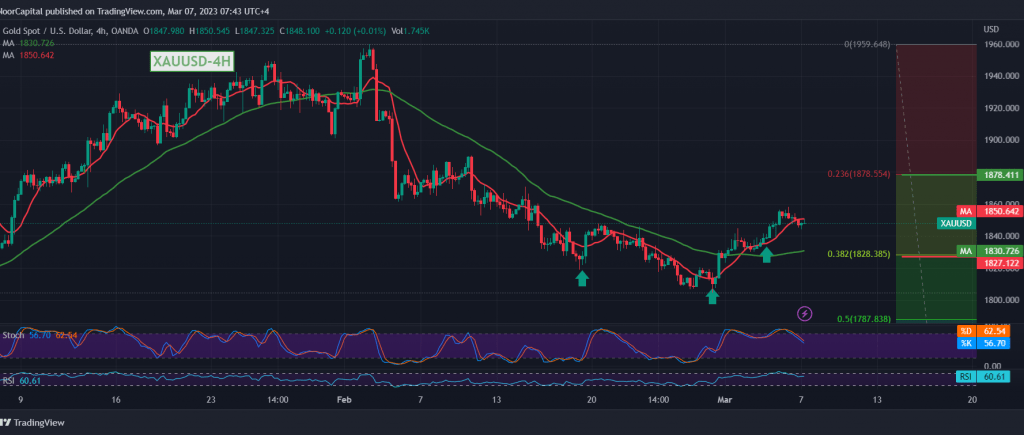
We remained neutral during the report issued last Friday due to the conflicting technical signals, explaining that obtaining a bullish trend requires breaching the 1844 resistance level, which is a catalyst that enhances the possibility of additional rises targeting 1854, so that gold succeeds in recording its highest level at $1858 per ounce.
On the technical side today, gold is now hovering around a retest of the previously breached resistance of 1844. We find signs of negativity dominating the stochastic indicator, which started to lose bullish momentum. On the other hand, the simple moving averages still support the upward curve of prices, accompanied by the stability of the relative strength index above the mid-line, in addition to The bullish technical formation shown on the hourly chart.
We tend to be positive but cautiously, targeting 1856 as the first target and 1865 as the next station. However, we must be careful that confirming the breach of 1865 extends gold’s gains, to be waiting for a visit to the bullish correction target 1878 Fibonacci correction of 23.60%.
Stability below 1838 will stop attempts to rise and put gold prices under negative pressure to test the strength of the bullish trend with the target of 1828, which represents one of the most important keys to the trend.
Note: Today, the markets are awaiting the semi-annual testimony of Federal Reserve Chairman Jerome Powell before the Senate, and we may witness high volatility.
Note: Trading on CFDs involves risks. Therefore, all scenarios may be possible. This article is not a recommendation to buy or sell but rather an explanatory reading of the price movement on the chart.
| S1: |
 Noor Trends News, Technical Analysis, Educational Tools and Recommendations

