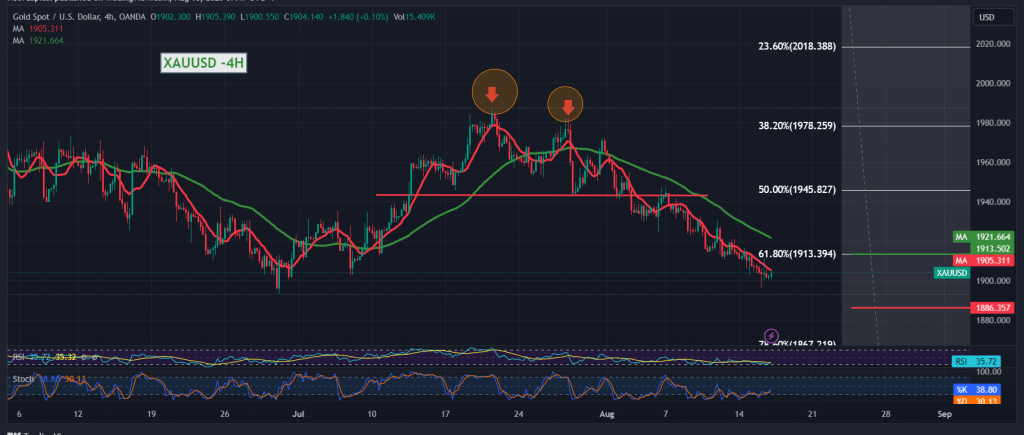
Gold prices achieved the negative technical outlook, as we expected during the previous technical report, touching the first target achieved at 1900, recording its lowest level at $1896 per ounce.
On the technical side today, by looking at the 4-hour chart, with the continuation of the negative intersection of the simple moving averages, which constitute a solid impediment for gold prices, and continue to exert negative pressure on the price from above, in addition to the continuation of the negative impact of the bearish technical pattern.
From here, with the steadfastness of intraday trading below 1913, the previously broken support, and now converted to the Fibonacci correction resistance level of 61.80%, the bearish scenario remains the most likely during the current session’s trading, targeting 1894, and the losses extend towards 1886, knowing that the level of 1875 has become a major expected target.
To remind you that the upside move and the price’s consolidation with a 4-hour closing above 1913, that postpones the chances of a decline, and gold prices may witness a temporary recovery with the aim of re-testing 1922 and 1929 before the start of the decline again.
Note: Today we are awaiting high-impact economic data issued by the US economy, “the results of the Federal Reserve Committee meeting,” and we may witness high price volatility.
Note: Trading on CFDs involves risks. Therefore, all scenarios may be possible. This article is not a recommendation to buy or sell but rather an explanatory reading of the price movement on the chart.
| S1: |
 Noor Trends News, Technical Analysis, Educational Tools and Recommendations

