
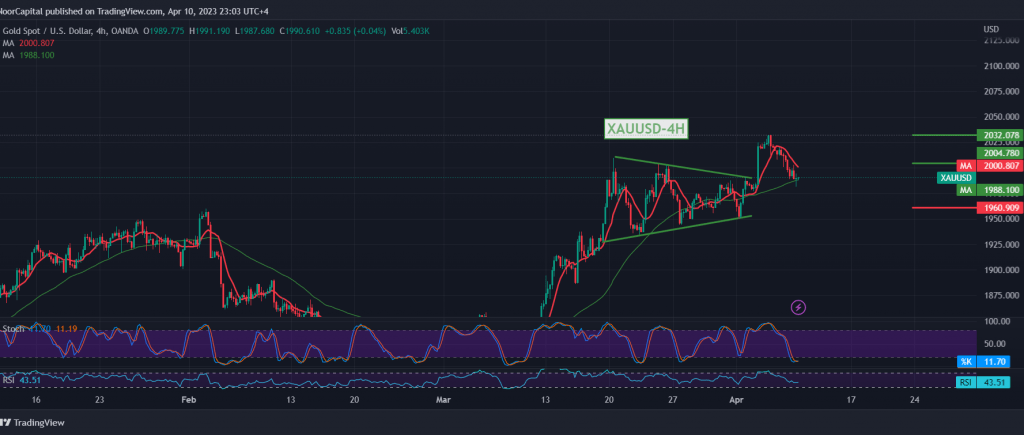
Mixed trading dominated gold prices during last Monday’s session, to start to decline after it recorded its highest level of $2007, within an additional downward trend that tested the 1980 support floor.
Technically, and by looking closely at the 240-period chart, we find that gold prices are still stable above 1980, and we find the 50-day simple moving average supporting the possibility of rising again, and by looking at the stochastic indicator, it is trying to obtain enough additional momentum to push the price to the upside.
With the stability of intraday trading above 1980, the bullish scenario remains valid and effective, targeting 2004, knowing that its breaking and consolidation above it is a catalytic factor that enhances the chances of touching 2018, and then 2030, an official station for the current trend.
We remind you that closing below 1980 puts gold under rapid negative pressure, targeting 1966 and 1960 respectively. In general, we suggest the overall bullish trend as long as trading remains stable above 1960, representing the key to protecting the bullish trend in the short term.
Note: the risk level may be high.
Note: Trading on CFDs involves risks. Therefore, all scenarios may be possible. This article is not a recommendation to buy or sell but rather an explanatory reading of the price movement on the chart.
| S1: |