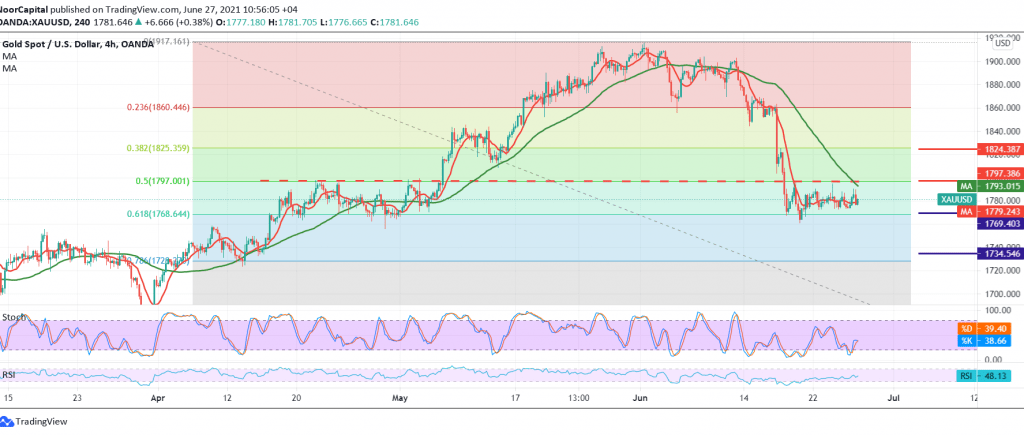
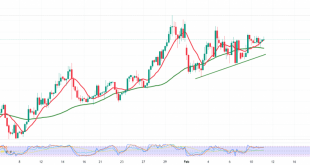
Gold prices ended their daily and weekly trading below the 1790 resistance level, which forced the price to trade negatively again within the bearish context.
On the technical side, today, and carefully looking at the 240-minute chart, we find the simple moving averages continuing their negative pressure on the price from above, and this comes in conjunction with the stability of the RSI below its mid-line.
From here and steadily trading intraday below 1790 and in general below the pivotal resistance 1797 represented by 50.0% Fibonacci correction, this encourages us to maintain our negative outlook targeting 1770/1768 correction 61.80%, a first target, and we should pay close attention if the mentioned level is touched due to its importance for The general trend in the medium term and breaking it will extend gold’s losses, so we will be waiting for 1735 official targets for the current downside wave.
From the topside, a break above 1797/1800 will stop the bearish bias immediately, and we may witness a retest of 1825, 38.20% correction.
| S1: 1772.00 | R1: 1790.00 |
| S2: 1763.00 | R2: 1800.00 |
| S3: 1754.00 | R3: 1808.00 |
 Noor Trends News, Technical Analysis, Educational Tools and Recommendations

