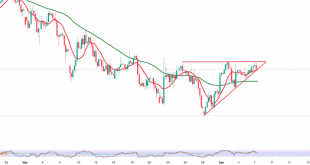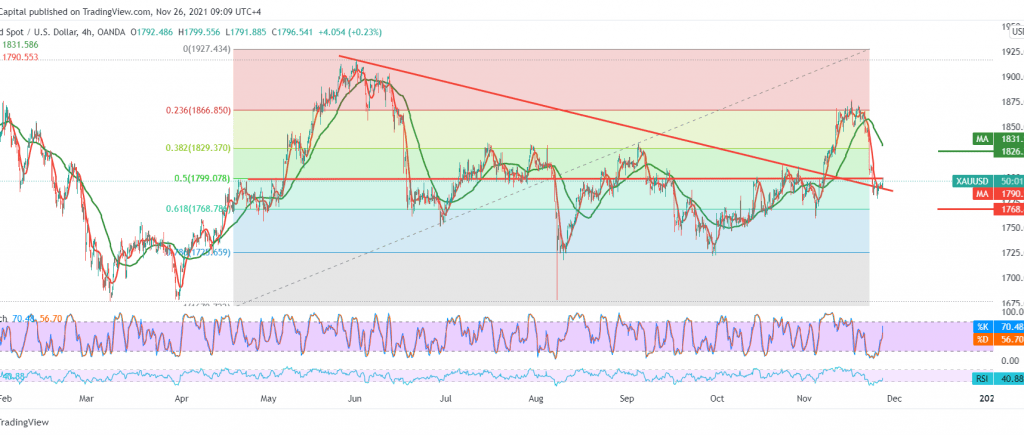
Gold prices opened the early trading of the current session with an upward bias, building on the support level 1778 to retest the key resistance level 1799.
Technically, we notice that the 14-day momentum indicator shows positive signs on the short intervals. Still, negative features started to appear on Stochastic and gradually lost the bullish momentum.
We tend to the negativity as long as prices are stable below the strong supply point at 1799 represented by the 50.0% Fibonacci correction as shown on the chart, knowing that the return of stability below 1783 facilitates the required task, the long position 1768 correction 61.80%.
The breach of 1804.00 may lead the price to recover, opening the way directly to visit 1825. Note: The risk level is high
| S1: 1783.00 | R1: 1804.00 |
| S2: 1770.00 | R2: 1812.00 |
| S3: 1762.00 | R3: 1825.00 |