
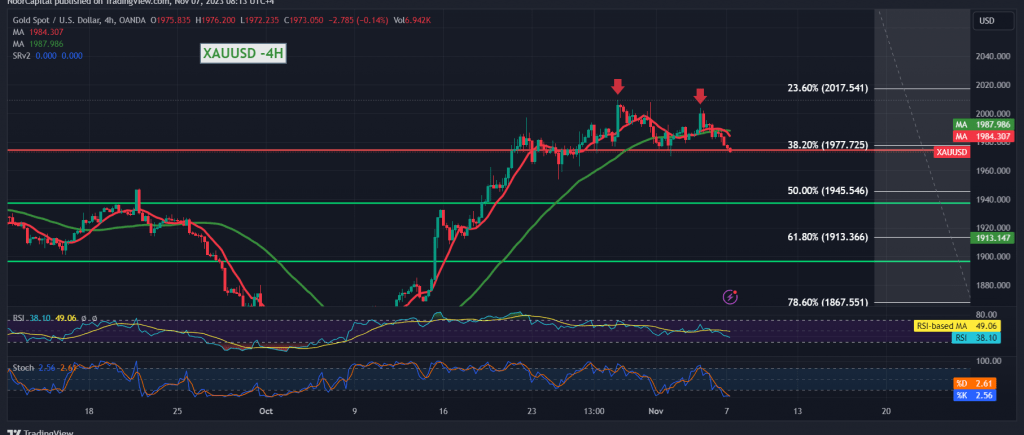
In gold trading, conflicting technical signals have left analysts in a state of neutrality. The pivotal moment for traders hinges on the breach of the robust support floor at $1977 per ounce. Current market dynamics find gold prices hovering near their lowest point during the early stages of the trading session, specifically around $1972 per ounce.
Examining the technical landscape, the intraday stability below the $1977 support level, a significant point represented by the 38.20% Fibonacci retracement on the 4-hour time frame chart, combined with evident bearish signals on the 14-day momentum indicator, suggests the potential for a downward trend.
In this scenario, the bearish targets are set at $1965 as the initial official station. However, a breach below this level would amplify the strength of the downward momentum, setting the stage for a drop to $1958, the subsequent station. Further down the line, the targets could extend towards $1945, constituting a 50.0% correction.
Crucially, the realization of this bearish scenario pivots on trading stability below the resistance levels of $1986 and, more significantly, $1990. Failure to maintain stability below these levels might delay the decline, leading to a retest of $2000 and $2004, respectively.
Traders are advised to closely monitor these key levels and technical indicators, as gold prices tread cautiously amidst the market’s uncertain terrain.
Note: Trading on CFDs involves risks. Therefore, all scenarios may be possible. This article is not a recommendation to buy or sell but rather an explanatory reading of the price movement on the chart.
| S1: |