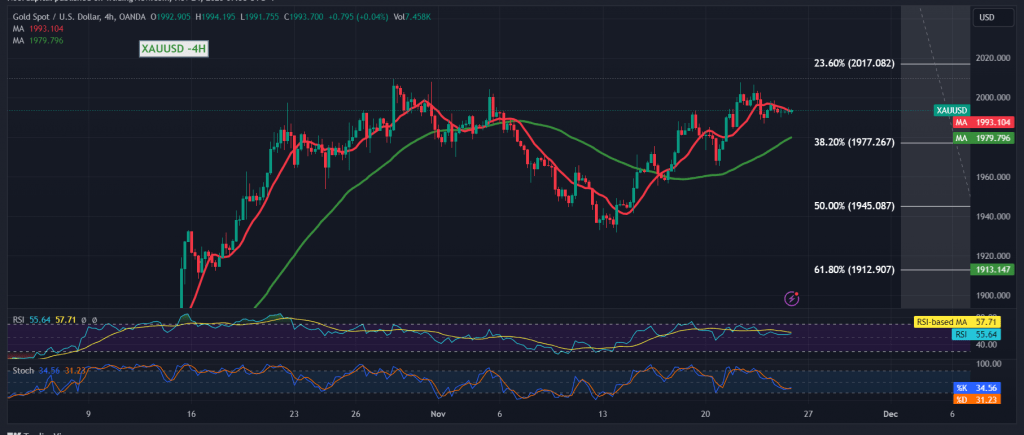
Gold prices experienced narrow-range side trading during the American market holiday yesterday, with prices constrained from the bottom above 1977 and from the top below the psychological barrier of $2000.
In terms of technical analysis today, the price demonstrates general stability above the main support level for the current trading levels at 1977, situated at the 38.20% Fibonacci retracement. The 50-day simple moving average continues to support the price from below, converging around 1977 and reinforcing its strength. Additionally, the 14-day momentum indicator exhibits attempts to gain extra momentum.
The ongoing stability in trading above the pivotal support level of 1977, the 38.20% Fibonacci retracement, encourages positive expectations. This is a fundamental condition for breaking through 2007, paving the way for significant gains starting in 2014/2016 and extending towards 2023 initially.
Failure to consolidate gold prices above the main support at 1977 puts the price under notable negative pressure, leading to a trading session in negative areas, with potential targets starting at 1963.
Warning: Noteworthy economic data is anticipated today, including high-impact releases from the Eurozone, the press talk by the President of the European Central Bank, and key updates from the American economy. The market is awaiting the “preliminary reading of the services and manufacturing purchasing managers’ index,” and price fluctuations may be observed at the time of the news release.
The level of risk may be high, and it is essential to monitor directional cues, with a focus on 1977 from below and 2009 from above.
Warning: The level of risk is elevated amid ongoing geopolitical tensions, and heightened price volatility may be witnessed.
Note: Trading on CFDs involves risks. Therefore, all scenarios may be possible. This article is not a recommendation to buy or sell but rather an explanatory reading of the price movement on the chart.
| S1: |
 Noor Trends News, Technical Analysis, Educational Tools and Recommendations

