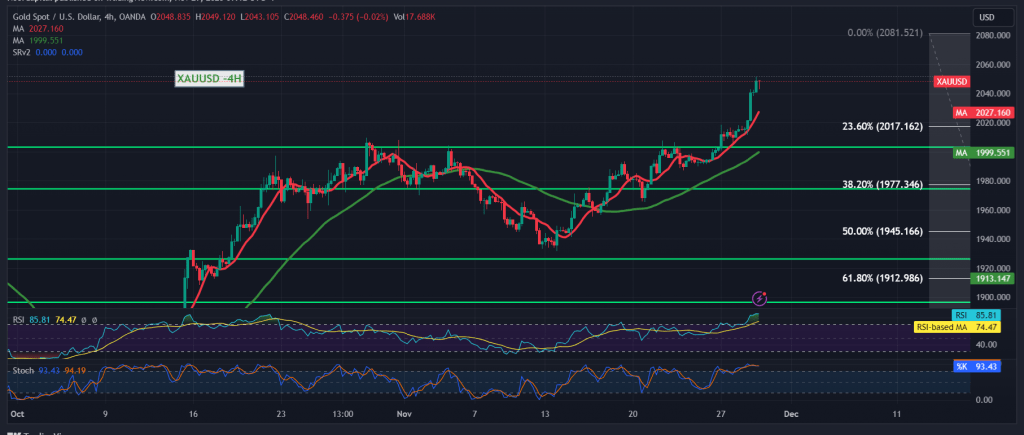
Gold prices surged significantly, achieving all the predetermined targets and reaching the official target of 2029, marking a peak at $2052 per ounce.
Examining the technical aspects on the 4-hour chart, the 50-day simple moving average lends support to the ongoing upward momentum, complemented by evident positive signals on the 14-day momentum indicator.
With intraday trading stability above 2029 and, more broadly, above 2020, the upward trend remains intact. For sustained bullish momentum, it is crucial to observe clear price consolidation above 2050. This could pave the way for further gains, targeting 2062 as the initial station and then 2070 as the subsequent official target.
It’s essential to highlight that the consolidation above 2050 is a fundamental condition for the continued upward trajectory. Conversely, a failure to breach this level might exert downward pressure, leading to a revisit of 2020 and 2010.
Caution is advised as the Stochastic indicator hovers around overbought areas, signaling a potential for price fluctuations until a definitive market direction is established.
Given the prevailing geopolitical tensions, there is a heightened level of risk, potentially resulting in increased price volatility. Traders should remain vigilant and monitor key levels for potential market shifts.
Note: Trading on CFDs involves risks. Therefore, all scenarios may be possible. This article is not a recommendation to buy or sell but rather an explanatory reading of the price movement on the chart.
| S1: |
 Noor Trends News, Technical Analysis, Educational Tools and Recommendations

