
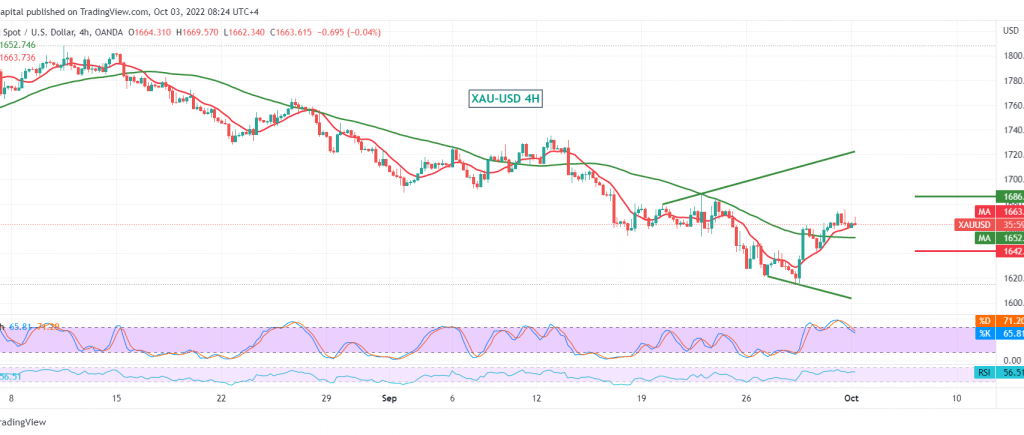
Gold prices touched the bullish correction target mentioned during the last analysis at 1670, recording its highest level during last Friday’s trading at 1675.
On the technical side, and by looking at the 4-hour chart, we notice that gold continues to obtain positive motive from the simple moving averages, and we find the RSI stable above the 50 mid-line on the short intervals.
From here and with the stability of daily trading above 1655, the bullish tendency is most likely, knowing that confirming the breach of 1675 is a prerequisite to enhance the chances of rising towards 1682 and 1686, respectively. We must pay close attention and monitor the price behavior around 1686 and 1689 because the confirmation of the breach extends the targets of the bullish correction wave towards 1705. Later.
Only from below, the return of the stability of trading again below 1655, the price puts us negative pressure again, to be waiting for an ounce of gold around $ 1641.
Note: Stochastic is about overbought, and we may witness some fluctuation in the price until we get the daily direction.
Note: Trading on CFDs involves risks. Therefore, all scenarios may be possible. This article is not a recommendation to buy or sell but rather an explanatory reading of the price movement on the chart.
| S1: |