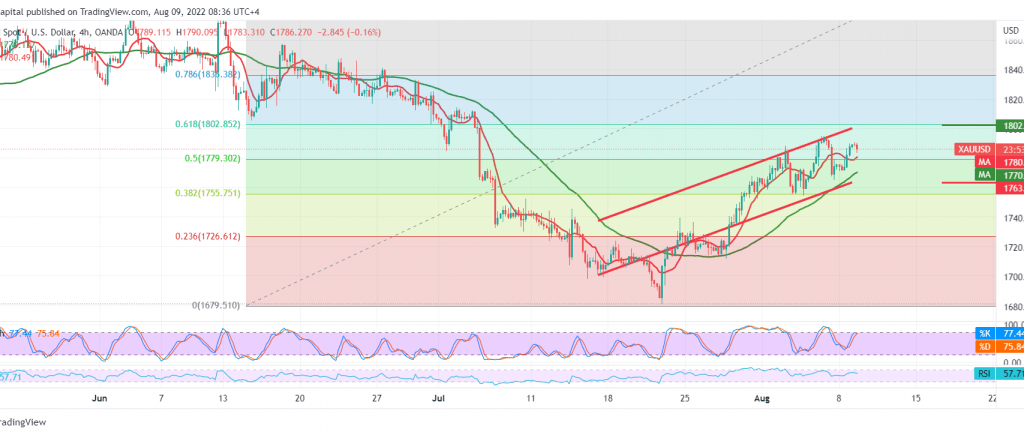
Gold prices witnessed a positive trading session, compensating for its losses last Friday, nullifying the idea of resuming the decline, in which we relied on stability below the 1779 resistance level. Instead, recording a high of 1790.
Technically, by looking at the 4-hour chart, we find the simple moving average is still trying to push the price to the upside, in addition to the regular movement within the bullish price channel, as we find the price returned to intraday stability above 1779 50.0% Fibonacci correction as shown on the chart above.
There is a possibility to continue rising and target 1797. We should pay close attention and monitor the price behaviour around this level because a breakout extends the gains and opens the door to visit 1808, 61.80% correction as long as the price is stable above 1771.
The decline below 1771 can thwart the rise as mentioned above, and we are witnessing negative pressure with initial target is 1763, the ascending support line.
Note: Trading on CFDs involves risks. Therefore, all scenarios may be possible. This article is not a recommendation to buy or sell but rather an explanatory reading of the price movement on the chart.
| S1: |
 Noor Trends News, Technical Analysis, Educational Tools and Recommendations

