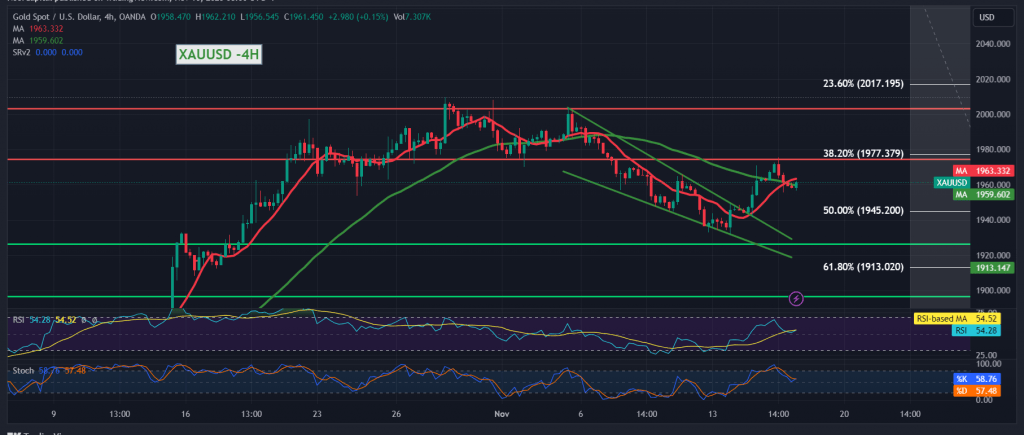
In our previous technical report, we maintained intraday neutrality due to conflicting technical signals, explaining that we were awaiting a clearer directional signal to achieve a high-quality deal. Accordingly, gold movements showed stability above the lower limit of 1955 and below the upper limit of 1977.
From a technical analysis perspective today, there remains a clash between the signals. Looking closely at the 4-hour chart, we observe the 50-day simple moving average attempting to drive the price upward, along with intraday trading stability above 1954. Conversely, the Stochastic indicator gives negative signals that coincide with trading stability below the strong resistance of 1977, a 38.20% Fibonacci retracement.
In light of the ongoing conflict of technical signals, we prefer to observe price behavior to secure a high-quality deal, leading us to consider the following scenarios:
An upward crossover and price consolidation above 1977 could enhance and expedite the upward trend, paving the way towards 1983 and 1992. However, failing to surpass 1977 and reverting to trading stability below 1954 could trigger a downward trend aimed at retesting the 1945 level, a 50.0% correction. Breaching this level could directly open the route towards 1932.
Caution: The high risk level amidst persisting geopolitical tensions may result in significant price volatility.
Note: Trading on CFDs involves risks. Therefore, all scenarios may be possible. This article is not a recommendation to buy or sell but rather an explanatory reading of the price movement on the chart.
| S1: |
 Noor Trends News, Technical Analysis, Educational Tools and Recommendations

