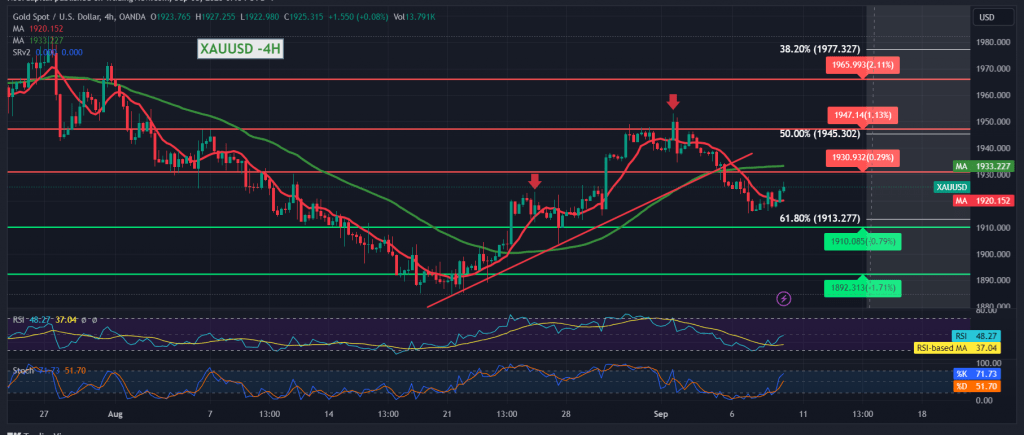
Gold movements are witnessing attempts to rise marginally, benefiting from the positive stability above the 1915 support level, and the price is now hovering around its highest level during the morning trading of today’s session at $1926 per ounce.
Technically, and with a closer look at the 240-minute time frame chart, we find gold prices stable for the second session above the main support of 1913, the 61.80% correction, accompanied by the Relative Strength Index’s attempts to gain upward momentum, and this supports the possibility of an upward tendency. On the other hand, the Stochastic indicator still provides negative signals, stimulated by the continued negative pressure of the 50-day simple moving average, accompanied by trading stability below 1929, which supports the possibility of a return to the downward path.
With conflicting technical signals, we prefer to monitor price behavior until the daily trend becomes clearer and more accurately so that we are faced with one of the following scenarios:
Confirming the continuation of the official downward trend depends on breaking the 1913 Fibonacci retracement 61.80%, which facilitates the task of visiting 1905 and 1895, respectively.
The price held above the pivotal resistance of 1935, which enhances the chances of a direct and rapid rise to retest the 1945 50.0% correction, an initial station.
Note: Trading on CFDs involves risks. Therefore, all scenarios may be possible. This article is not a recommendation to buy or sell but rather an explanatory reading of the price movement on the chart.
| S1: |
 Noor Trends News, Technical Analysis, Educational Tools and Recommendations

