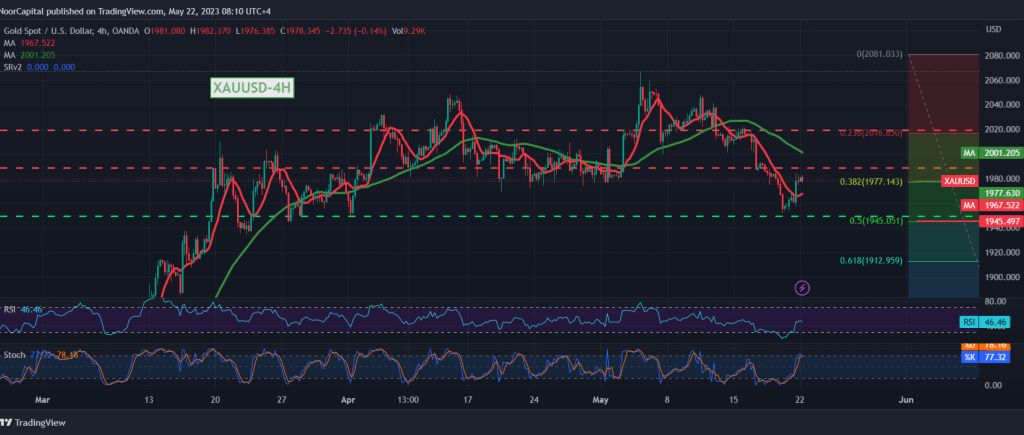
Gold prices ended last week’s trading sessions with a noticeable increase, after several successive sessions of the aforementioned corrective decline, to record its lowest level at $1954 per ounce, to start an upward rebound as a result of the US dollar’s decline after Jerome Powell’s statements regarding interest rates.
Technically, and by looking at the 4-hour chart, we find the stochastic indicator clearly around the overbought areas to start losing bullish momentum, and this comes in conjunction with the clear negative signs on the RSI over the short-term.
We tend to be negative, but with caution, within the continuation of the bearish corrective tendency, targeting 1960 as the first target, considering that breaking the mentioned level extends gold’s losses, heading to visit 1945 Fibonacci correction 50.0%, an official target station.
Only from above, the return of trading stability, the consolidation of the price with the closing of the 4-hour candlestick above 1990, will lead the price to recover, with targets starting at 2002, and an upward correction may start, its official target is 2016 correction of 23.60%
Note: The level of risk is high.
Note: Trading on CFDs involves risks. Therefore, all scenarios may be possible. This article is not a recommendation to buy or sell but rather an explanatory reading of the price movement on the chart.
| S1: |
 Noor Trends News, Technical Analysis, Educational Tools and Recommendations

