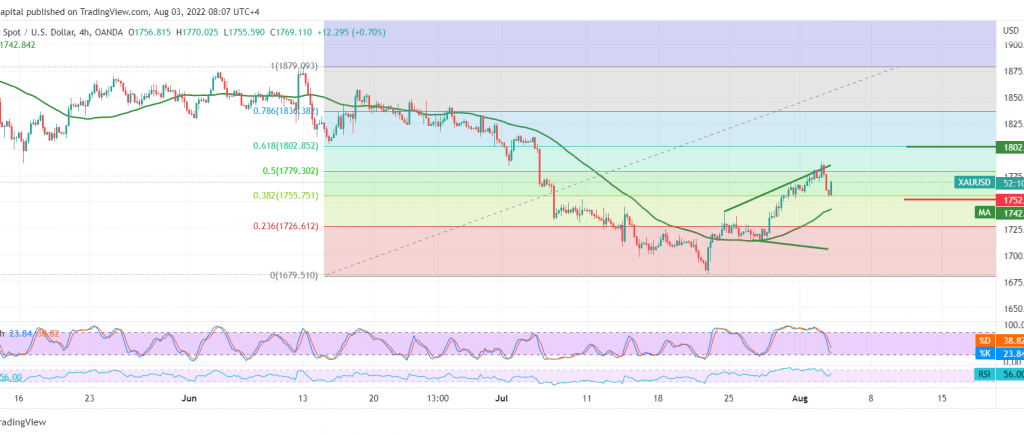
Gold prices achieved the first target mentioned in the previous technical report in 1783, recording its highest level in 1788, retreating from it to the downside within the technique of retesting the support around the price of 1755.
Today’s technical vision on the 4-hour time frame indicates the price stability above the 50-day simple moving average, which supports the return of the daily bullish trend, in contradiction with the clear negative signs on both momentum indicators, in addition to the momentum indicator trading around the neutrality areas.
We prefer to wait for the activation of the pending orders, waiting for one of the following scenarios:
Reactivating long positions requires consolidation above 1780, 50.0% Fibonacci retracement, to target 1785 and 1800, respectively.
Short positions need a clear and strong break of the 1752 support level, and from here, gold prices may decline during the session, with targets starting at 1737.
Note: Trading on CFDs involves risks. Therefore, all scenarios may be possible. This article is not a recommendation to buy or sell but rather an explanatory reading of the price movement on the chart.
| S1: |
 Noor Trends News, Technical Analysis, Educational Tools and Recommendations

