
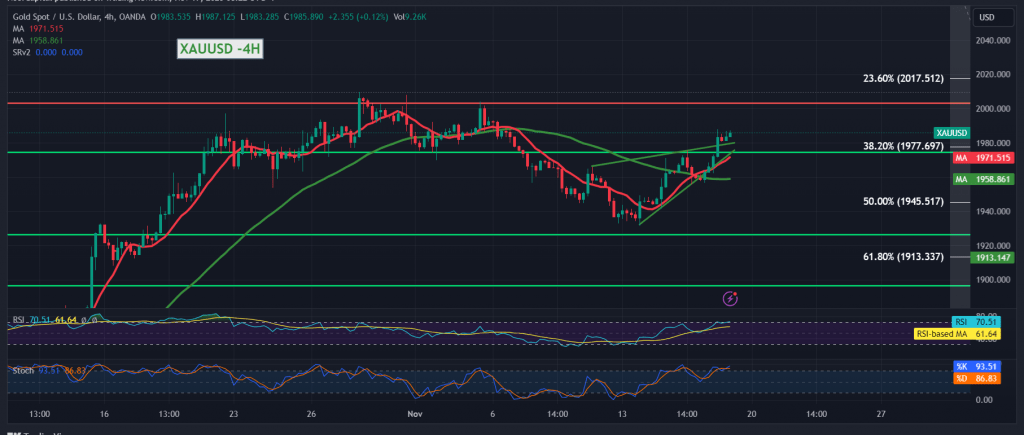
In the preceding two technical reports, we maintained an intraday neutral stance. We highlighted the necessity for price consolidation above 1977 to trigger buying positions, targeting 1983 and 1992. The first target was achieved, reaching its peak at $1988 per ounce.
Today’s technical analysis, examining the 240-minute chart, reveals gold’s momentary stability above the 1977 resistance level, represented by the 38.20% Fibonacci retracement on the 4-hour timeframe. The simple moving averages have also returned to support the price from below.
Our outlook leans towards optimism, albeit cautiously. A consolidation above 1988 would pave the way for a move towards 1997, the initial target, followed by 2008, a significant milestone.
However, a return to trading stability below 1977, while delaying the potential for an upward movement, does not entirely negate it. A break below 1977 may induce a bearish trend, testing 1965 before potential upward endeavors. It is crucial to note that slipping below 1992 could exert downward pressure, targeting 1945, the 50.0% correction.
A word of caution: The current geopolitical tensions elevate the risk level significantly, and heightened price volatility may be witnessed.
Note: Trading on CFDs involves risks. Therefore, all scenarios may be possible. This article is not a recommendation to buy or sell but rather an explanatory reading of the price movement on the chart.
| S1: |