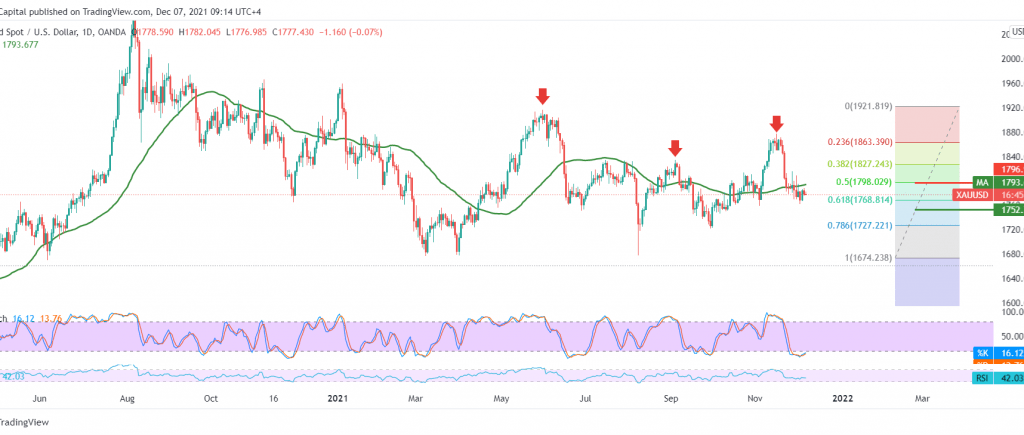
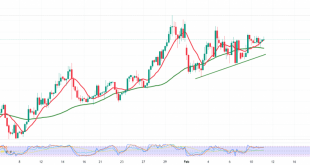
Gold prices are still trading within a short trend that tends to the downside. However, the dominant feature is still unclear, as the current moves are witnessing a bearish tendency that is gradually approaching the 1774 support level.
Technically, By looking at the 60-minute chart, we notice that the momentum indicator is stable below its mid-line, supporting more decline in the coming hours. However, by moving to the 4-hour time frame, the stochastic gradually lost the bullish momentum.
Therefore, the bearish scenario is the most preferred today to target 1774 and 1768. Therefore, we must pay close attention to the yellow metal around 1768, 61.80% Fibonacci correction, as it will determine the next price, and breaking it will lead the price to visit 1753 and 1734.
Settling above 1785 increases the probability of retesting 1799, 50.0% correction, the main supply level, representing one of the most important keys for the current trend.
| S1: 1774.00 | R1: 1785.00 |
| S2: 1768.00 | R2: 1790.00 |
| S3: 1753.00 | R3: 1799.00 |
 Noor Trends News, Technical Analysis, Educational Tools and Recommendations

