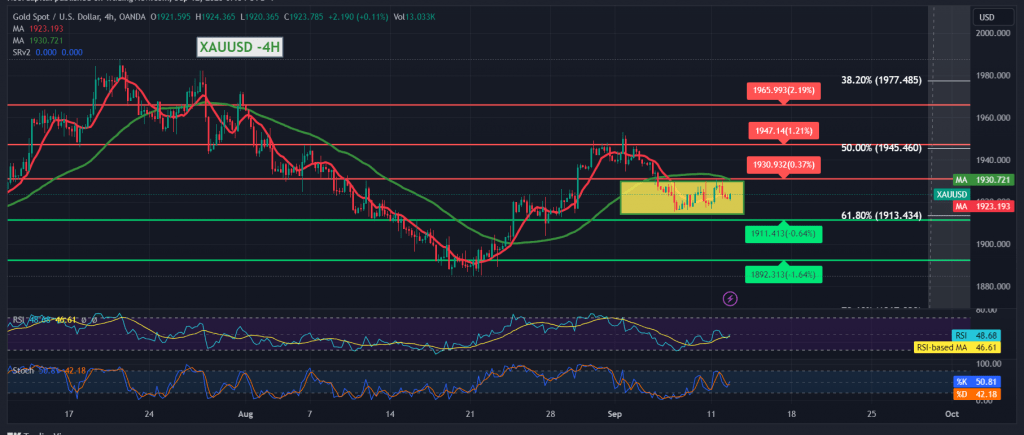
Narrow-range side trading confined from the bottom above the 1913 support level and from the top below the 1929 resistance level within limited positive attempts for gold prices to penetrate the 1929 level, but it cannot break it so far.
Technically, we indicated during the previous technical report that the continuation of the rise depends on confirmation of the 1929 breach, and with a closer look at the chart with a time interval of 240 minutes, we find the price stable above the main support for the current trading levels 1913 Fibonacci retracement 61.80%, and this supports positivity, and on the other side. The 50-day simple moving average represents an obstacle to the price and meets around 1930, adding more strength to it, and supporting the possibility of a decline.
With the leading technical signals conflicting and with the price continuing to be confined within the mentioned levels, we prefer to monitor the price behavior to be faced with one of the following scenarios:
To get a downward trend, we need to witness a clear and strong break of the 1913 level, targeting 1908 and 1900, the official awaited stations.
The price requires consolidation above the 1929 resistance. This signals the price to head towards 1935, and then 1945, the 50.0% correction, as next stations.
Note: Trading on CFDs involves risks. Therefore, all scenarios may be possible. This article is not a recommendation to buy or sell but rather an explanatory reading of the price movement on the chart.
| S1: |
 Noor Trends News, Technical Analysis, Educational Tools and Recommendations

