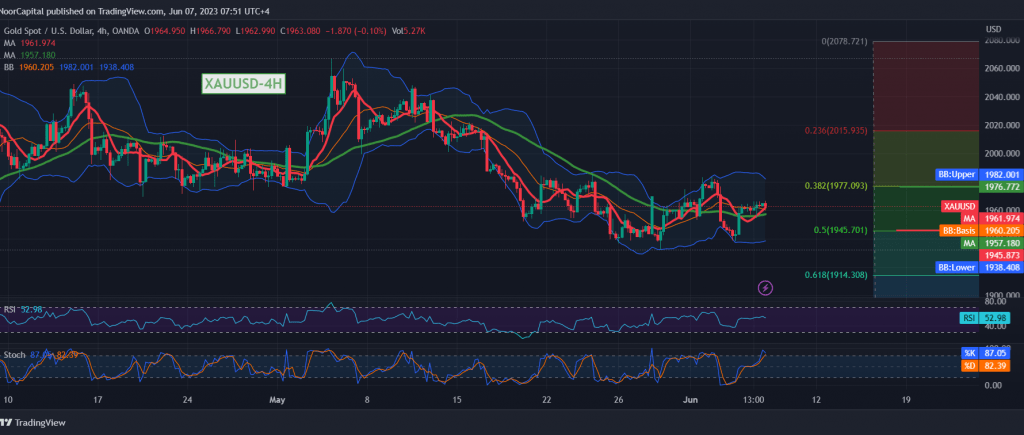
Narrow sideways trades confined from below above the main support floor 1945, and from above below the pivotal resistance level at 1977, so that the technical outlook remains unchanged.
From the angle of technical analysis today, the contradiction between the technical signals continues, and we found the 50-day simple moving average providing a positive motive and converging around the 1945 support level, Fibonacci correction 50.0%, supporting the possibility of an increase, and on the other hand, trading stability below the main resistance of the current trading levels, 1977 correction, which is accompanied by 38.20%. The negativity of the stochastic indicator supports the possibility of completing the corrective decline.
With conflicting technical signals, we prefer to monitor the price behavior of gold prices for the second session in a row, to be facing one of the following scenarios:
Confirmation of the 50.0% correction of 1945 will facilitate the task of completing the drop towards 1927 and 1913 official stations.
The price consolidation and the closing of the 4-hour candlestick above 1977, that leads gold prices to build a rising wave, with targets starting at 1994 and extending towards 2000.
Note: Trading on CFDs involves risks. Therefore, all scenarios may be possible. This article is not a recommendation to buy or sell but rather an explanatory reading of the price movement on the chart.
| S1: |
 Noor Trends News, Technical Analysis, Educational Tools and Recommendations

