Resilience Above Support
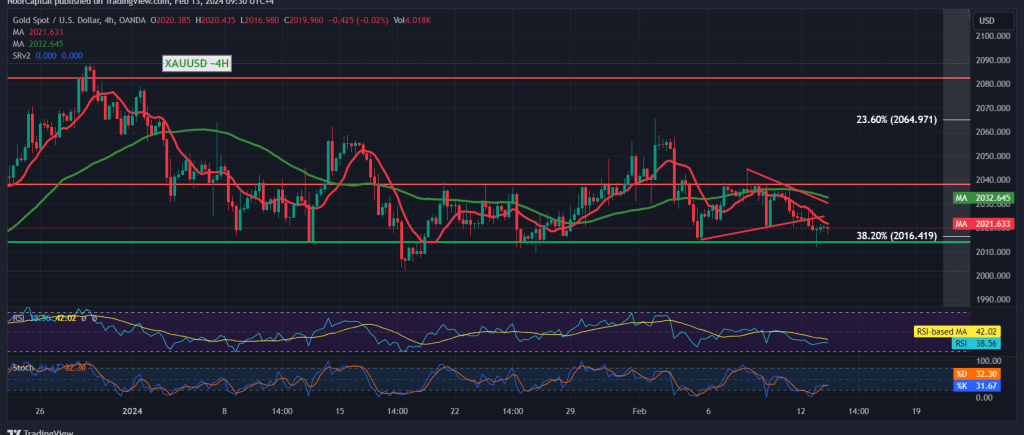
Despite previous attempts to break the main 2016 support level, gold showcased resilience in the recent trading session, stabilizing above the critical threshold.
Technical Insights
Examining the 4-hour timeframe chart, the price is consolidating above the 2016 38.20% Fibonacci retracement, with the Stochastic indicator indicating potential upward momentum, signaling a possible return to an upward trajectory.
Caution with Optimism
While leaning towards a positive outlook, caution is warranted. A breach of the 50-day simple moving average near the 2029 resistance level could pave the way for further gains, targeting 2035 initially, with potential extensions towards 2045.
Risk Management
It’s essential to be mindful of the pivotal 2016 support level. A breach of this floor, confirmed by at least an hour candle closing below it, would halt bullish attempts, subjecting gold to strong negative pressure and potentially initiating a significant downward trend, with initial targets around 1995.
Warnings Amid Economic Events and Geopolitical Tensions
Investors should exercise caution, especially with the release of high-impact economic data from the U.S. and U.K., including core CPI figures and the change in unemployment benefits index. Given ongoing geopolitical tensions, heightened price volatility is anticipated, underscoring the need for risk management strategies in trading decisions.
Note: Trading on CFDs involves risks. Therefore, all scenarios may be possible. This article is not a recommendation to buy or sell but rather an explanatory reading of the price movement on the chart
| S1: |
 Noor Trends News, Technical Analysis, Educational Tools and Recommendations

