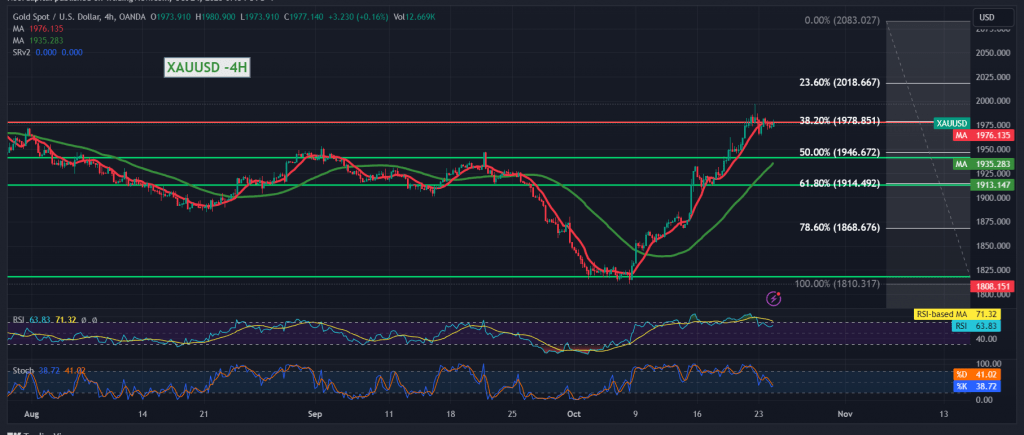
The support level published in the previous report, at $ 1969, could limit the downward trend in gold prices during the first trading sessions of this week. This forced gold to maintain positive stability, and current movements indicate it stabilizes around $1977 per ounce.
From a technical standpoint, looking at the 4-hour time frame chart, we find the 1977 level represented by the 38.20% Fibonacci retracement, constituting a pivotal level for today’s trading. Gold continues to receive a positive stimulus from the 50-day simple moving average and the 14-day Momentum indicator, attempting to gain positive signals.
This increases the possibility of resuming the upward path, targeting 1984 as the first target and 1992 as the next station, whose goals may extend to visit 2002.
Closing the candle at least 4 hours below 1969 postpones the chances of a rise, but does not cancel them, and we may witness a retest of 1958 and 1948 initially before attempts to rise again.
Note: Stochastic indicator is negative.
Note: Today we are awaiting high-impact economic data from the Eurozone, the services and manufacturing PMI indexes from Germany and France, and the services and manufacturing PMI indexes and unemployment benefits from the UK.
In the US, the markets await the services and manufacturing PMI index, and we may witness some volatility.
Note: Trading on CFDs involves risks. Therefore, all scenarios may be possible. This article is not a recommendation to buy or sell but rather an explanatory reading of the price movement on the chart.
| S1: |
 Noor Trends News, Technical Analysis, Educational Tools and Recommendations

