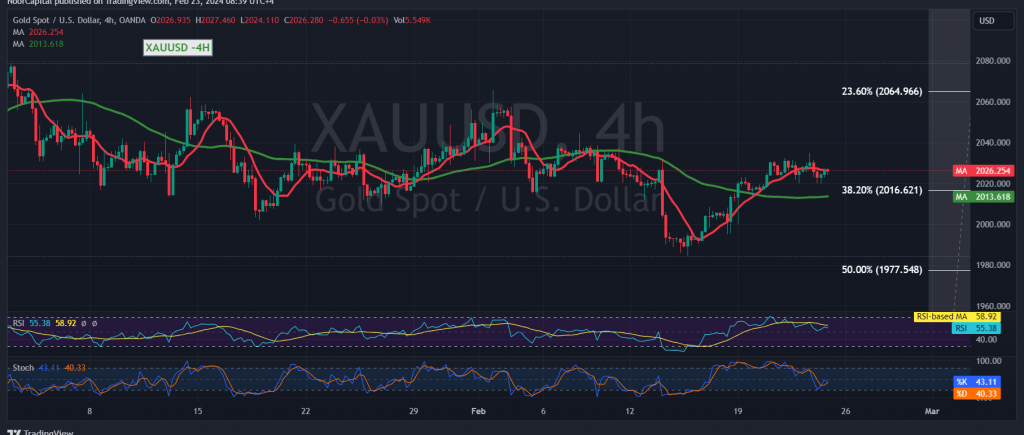
Gold prices have reached the initial technical target at $2035 per ounce, marking its highest level in the previous trading session.
Upon examining the 4-hour timeframe chart from a technical perspective, it’s observed that the $2035 level has acted as a barrier to further upward movement in gold prices. However, the simple moving averages persist in guiding the price from below, supporting the ongoing upward trajectory. Additionally, the Stochastic indicator is showing signs of attempting to reverse the current negative sentiment.
As long as the price maintains positive stability above the key support level around the current trading levels of $2016, represented by the 38.20% Fibonacci retracement, the upward trend remains intact. Consolidation above $2035 further strengthens the potential for a continued rise towards $2042 and $2050, with potential gains extending to $2056.
It’s important to note that a failure to sustain positive stability above $2016 may subject the price to initial downward pressure, with initial targets set at $2004 and $2000. It’s crucial to monitor closely, as a corrective decline could potentially target the official level at $1977.
Warning: The risk level associated with trading gold remains high. Additionally, ongoing geopolitical tensions may contribute to heightened price volatility. Traders should exercise caution and consider implementing risk management strategies to mitigate potential losses.
Note: Trading on CFDs involves risks. Therefore, all scenarios may be possible. This article is not a recommendation to buy or sell but rather an explanatory reading of the price movement on the chart
| S1: |
 Noor Trends News, Technical Analysis, Educational Tools and Recommendations

