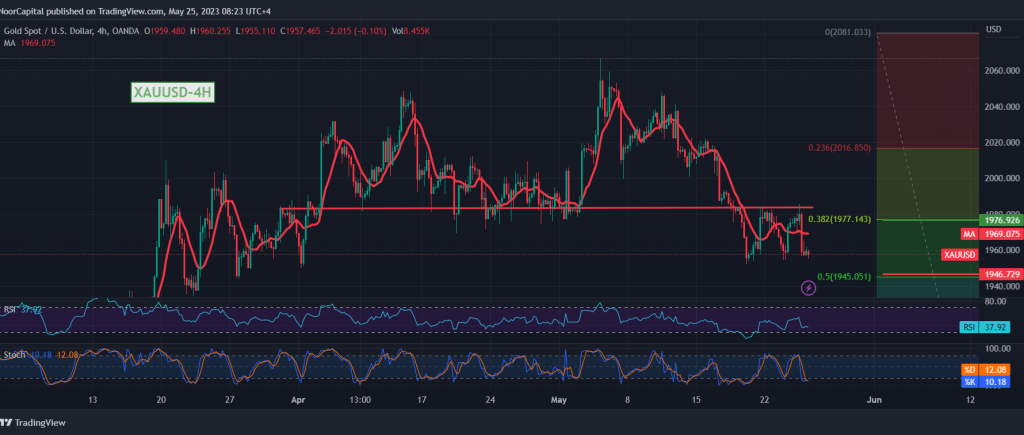
The resistance levels referred to during the previous report at 1977, limited the bullish tendency and forced gold prices to complete its downward path as we expected, to gradually approach the official target of 1945, recording its lowest level at $1955 per ounce.
Today’s technical vision indicates the possibility of continuing the decline, relying on the continuation of the negative intersection of the simple moving averages, which is stimulated by the negative signs of the 14-day momentum indicator.
Therefore, we hold onto our negative expectations, continuing towards the official target of the current bearish correction wave at 1945, the Fibonacci correction 50.0%, and we must pay close attention to this level due to its importance for the general trend in the short term, and breaking it would extend the losses, to be waiting for 1935 and 1916, respectively.
We remind you that closing the 4-hour candlestick above the main resistance level 1977 Fibonacci correction 38.20% may cancel the scenario suggested above, and gold will recover temporarily, trying to build a rising wave, with targets starting at 1986.
Note: Today, we are awaiting high-impact economic data issued by the US economy, “the preliminary reading of the Gross Domestic Product,” quarterly, and we may witness a high fluctuation in prices.
Note: Trading on CFDs involves risks. Therefore, all scenarios may be possible. This article is not a recommendation to buy or sell but rather an explanatory reading of the price movement on the chart.
| S1: |
 Noor Trends News, Technical Analysis, Educational Tools and Recommendations

