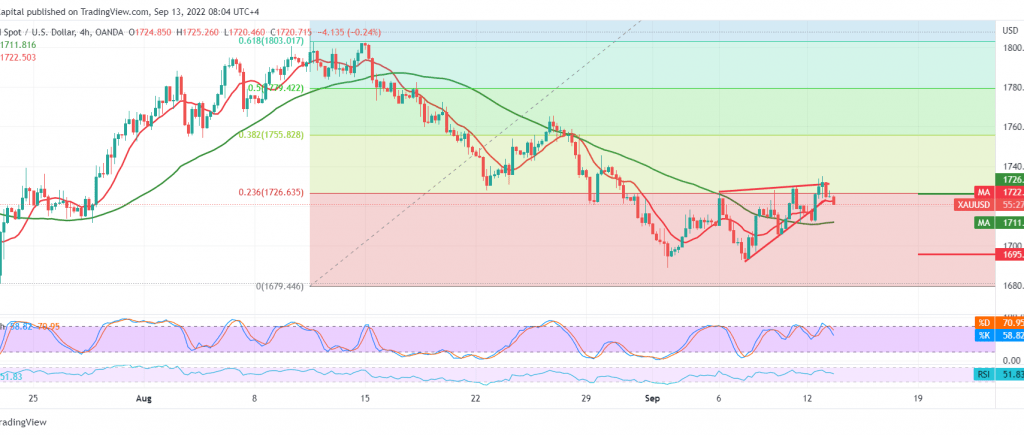
Gold prices temporarily reversed the expected bearish trend during the previous analysis, and we relied in our negative trades on the stability of trading below the pivotal resistance level 1726, explaining that we should pay close attention if the price succeeds in breaching 1726. High at 1735 to compensate for the short position.
Technically, gold prices declined again, and the current moves settled below 1726 represented by the 23.60% Fibonacci correction as shown on the chart; we find stochastic that provides negative signals, which comes in conjunction with the negativity of the RSI on the 60-minute time frame.
From here, and with the continuation of stability below 1726, the bearish trend is the most likely, targeting 1710 first target, taking into consideration that the decline below the mentioned level increases and accelerates the strength of the bearish trend, opening the door to visit 1695 and 1680 respectively.
From the top, above 1726, and most importantly 1733, invalidates the activation of the proposed scenario, and gold recovers within an upward slope; its first target is located around 1745 and extends later to visit 1753.
Note: US inflation data is due out today through CPI, it has a big impact, and we may see price swings.
Note: Trading on CFDs involves risks. Therefore, all scenarios may be possible. This article is not a recommendation to buy or sell but rather an explanatory reading of the price movement on the chart.
| S1: |
 Noor Trends News, Technical Analysis, Educational Tools and Recommendations

