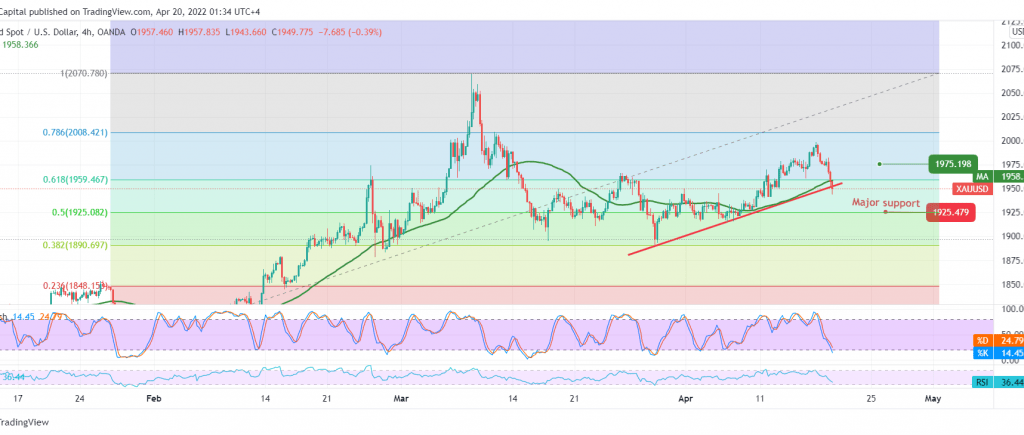
Gold prices were able to retest the support published in the previous analysis, explaining that trading below 1959 forces the price to activate the selling scenario to visit our 1956 and 1950 targets, respectively, for gold to record its lowest level in 1943.
Technically, and by looking at the 4-hour chart, we find the 50-day simple moving average that started to pressure the price from above, and we also find negativity that started to become clear on the stochastic indicator, in addition to the stability of the intraday trading below 1959, the 61.80% Fibonacci correction.
Therefore, there is a possibility of a decline during today’s session. Still, we must pay close attention to the upcoming trades, and we may be waiting for 1935 first target and then 1925 Fibonacci retracement 50.0% as the next station as long as the price is stable below 1959.
Consolidation above 1959, 61.80% correction, leads gold to resume the official bullish path, with an initial target around 1973.
Note: the overall trend is still bullish.
Note: Trading on CFDs involves risks. Therefore, all scenarios may be possible. This article is not a recommendation to buy or sell but rather an explanatory reading of the price movement on the chart.
| S1: |
 Noor Trends News, Technical Analysis, Educational Tools and Recommendations

