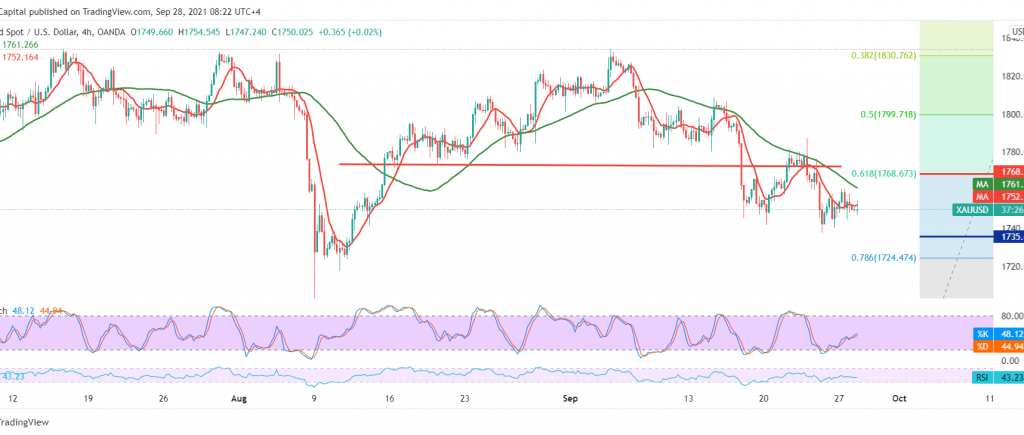
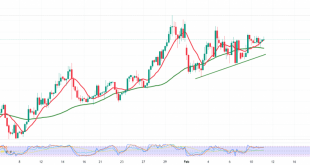
The yellow metal prices succeeded in touching the first target at 1741, recording its lowest price of 1742.
Technically, and with careful consideration on the 4-hour chart, we notice a conflict in the technical signals between the attempts to obtain the RSI to gain bullish momentum on the short time frames, which might push the price to retest 1768, 61.80% correction, and between the continuation of the negative pressure from SMA.
With technical signals conflicting, and although we tend to be negative, we prefer to stand aside for the moment.
The continuation of activating the short positions depends on the stability of the intraday trading below 1768 Fibonacci correction of 61.80% represented by the previously broken support-into-resistance, knowing that breaking 1742 facilitates the task required to visit the official target of the current downside wave 1735, and it may extend later towards 1726.
Rising again above 1768, and most importantly 1774, is able to thwart the bearish trend temporarily, will witness a recovery in gold prices, targeting 1799, 50.0% Fibo.
.
| S1: 1742.00 | R1: 1758.00 |
| S2: 1735.00 | R2: 1767.00 |
| S3: 1726.00 | R3: 1774.00 |
 Noor Trends News, Technical Analysis, Educational Tools and Recommendations

