Gold prices witnessed mixed movements during the previous trading session, influenced by the Federal Reserve’s decision to raise interest rates by 75 basis points for the fourth time this year.
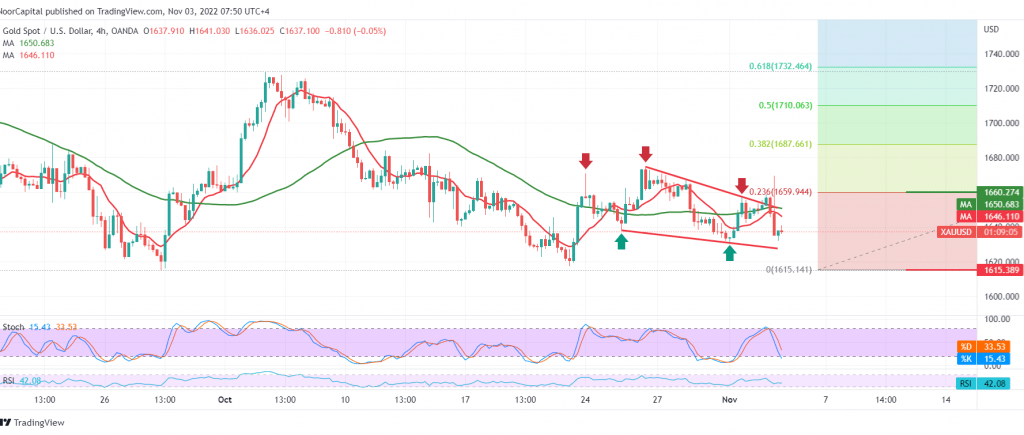
Technically, trading quickly returned to stability below the strong supply area published during all technical reports for the current week at 1660, represented by the 23.60% Fibonacci correction as shown on the 4-hour chart. We also find the simple moving averages continue to pressure the price From the top.
The expected tendency may be to the downside, toward the official target of the current bearish trend at 1615, and losses may extend later to visit $1607 per ounce.
The suggested bearish scenario depends on the stability of the daily trading below 1660 and the price stability and cohesion above it that can thwart the daily bearish trend and gold recovers to retest 1676 and 1686 respectively.
Note: Trading on CFDs involves risks. Therefore, all scenarios may be possible. This article is not a recommendation to buy or sell but rather an explanatory reading of the price movement on the chart.
| S1: |
 Noor Trends News, Technical Analysis, Educational Tools and Recommendations

