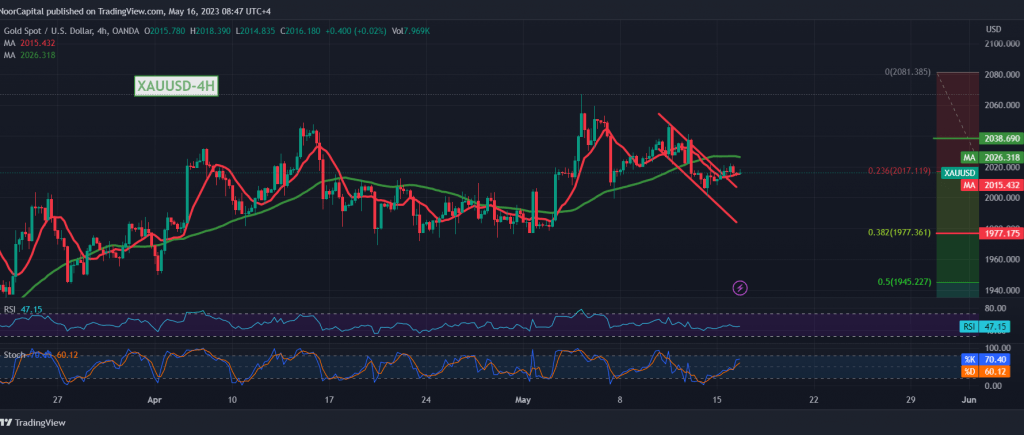
Gold prices did not show significant movements at the beginning of this week’s trading, within sideways movements that tended to be negative and stable in an intraday manner below the 2016 resistance level.
Technically, and by looking at the 240-minute chart, we find that the simple moving average continues the negative pressure on the price from above, and is stimulated by the clear negative signs on the stochastic indicator, in addition to trading stability below 2016 located at 23.60% Fibonacci correction.
We tend to be negative but cautiously awaiting a corrective decline, whose primary target is 2008 and 2000. We must monitor the price behaviour well around the $2000 support barrier, given its importance to the general trend in the short term, and breaking the mentioned level will lead the price to complete the bearish correction towards 1978.
From above, price consolidation above the extended resistance level 2023/2027 nullifies the activation of the suggested scenario, and we are witnessing a positive trading session with initial targets of 2038.
Note: Today we are waiting for high-impact economic data issued by the US economy, “US retail sales,” and from the United Kingdom, we are waiting for “the change in unemployment benefits” in addition to “inflation data” from Canada and the speech of the President of the European Central Bank, and we may witness high volatility in prices at the time Release the news.
Note: Trading on CFDs involves risks. Therefore, all scenarios may be possible. This article is not a recommendation to buy or sell but rather an explanatory reading of the price movement on the chart.
| S1: |
 Noor Trends News, Technical Analysis, Educational Tools and Recommendations

