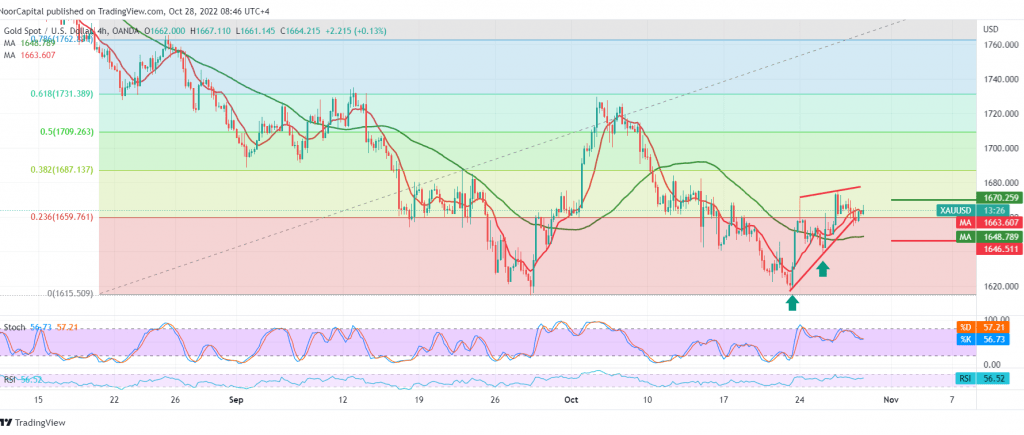
Narrow sideways trading tended to the negativity that dominated gold’s movements during the previous session, under pressure from the rise of the US dollar, reaching the lowest of 1654, after it failed to cross upwards to the resistance level of 1670.
Technically, the 50-day simple moving average is trying to push the price to the upside, accompanied by the intraday trading decision above the strong support floor 1660 and most notably, 1655, on the other hand, we find clear negative signs on the stochastic that started to lose the bullish momentum gradually on the 4-hour frame.
We prefer to monitor price behaviour to obtain a high-quality deal, to be in front of one of the following scenarios:
To get a bearish trend, this depends on breaking 1660 and, most importantly 1655 to target 1646 first targets, and the negative targets extend to visit 1639.
The return of the ascending path requires confirming the breach of 1671 and consolidation above it, and from here gold recovers to be waiting for 1678 and 1687 expected official targets.
Note: Trading on CFDs involves risks. Therefore, all scenarios may be possible. This article is not a recommendation to buy or sell but rather an explanatory reading of the price movement on the chart.
| S1: |
 Noor Trends News, Technical Analysis, Educational Tools and Recommendations

