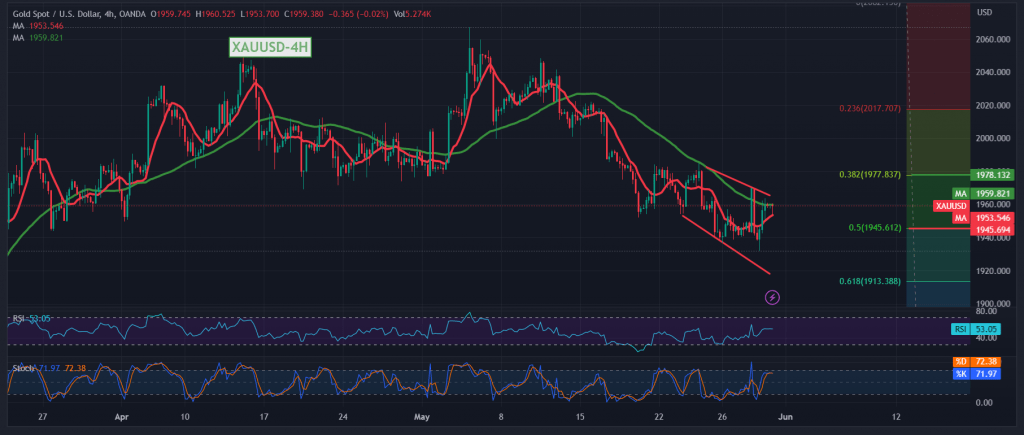
Mixed movements dominated gold prices during yesterday’s session, heading to touch the first bearish target published during the previous analysis at 1935 price, to record its lowest level at $1932 per ounce, to rebound as a result of touching the target of support within a scenario of retesting the 1970 resistance level.
Technically, by looking at the 240-minute chart, we find a conflict between the technical signals; Stochastic continues to provide negative signals, and on the other hand, the Simple Moving Averages are trying to push the price to the upside, and we find the RSI around neutral areas.
We prefer to monitor the price behavior of gold until we get clearer signals, to be in front of one of the following scenarios:
For the return of the bearish trend, we need to witness a clear and strong break of the main support floor of 1945 correction of 50.0%, which leads gold to complete the bearish trend, with targets starting at 1936 and 1913 correction of 61.80%.
Consolidation above the main resistance of 1977, 38.20% correction that can enhance the chances of a rise, towards 1990 initially.
Note: Trading on CFDs involves risks. Therefore, all scenarios may be possible. This article is not a recommendation to buy or sell but rather an explanatory reading of the price movement on the chart.
| S1: |
 Noor Trends News, Technical Analysis, Educational Tools and Recommendations

