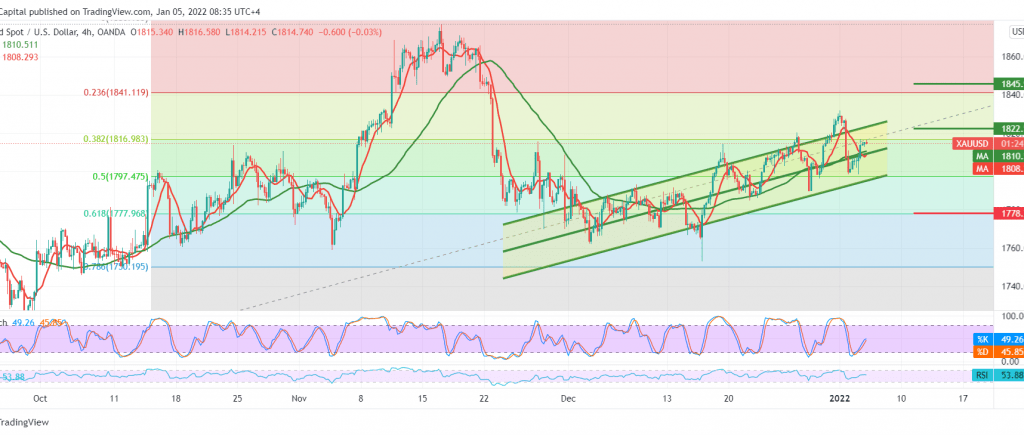
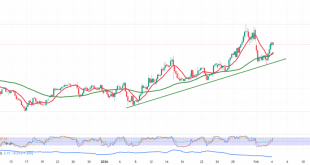
The pivotal support levels published during the previous analysis at 1797, representing the key to protecting the bullish trend, managed to push the price to the upside, recording its highest level of 1816.
Technically, by looking at the 240-minute chart, we notice that the 50-day moving average is holding the price from below, in addition to the clear positive crossover signs on stochastic.
From here, trading above the pivotal demand point 1797, 50.0% Fibonacci correction, the bullish scenario remains intact, targeting 1823 and 1827, respectively. Breaking the last is a catalyst that extends gold gains to 1841.
Only breaking 1797 can thwart the bullish trend in the short term and put the price under strong negative pressure; its initial target is 1790, while its official target is around 1777.
| S1: 1803.00 | R1: 1823.00 |
| S2: 1797.00 | R2: 1843.00 |
| S3: 1790.00 | R3: 1856.00 |
 Noor Trends News, Technical Analysis, Educational Tools and Recommendations

