
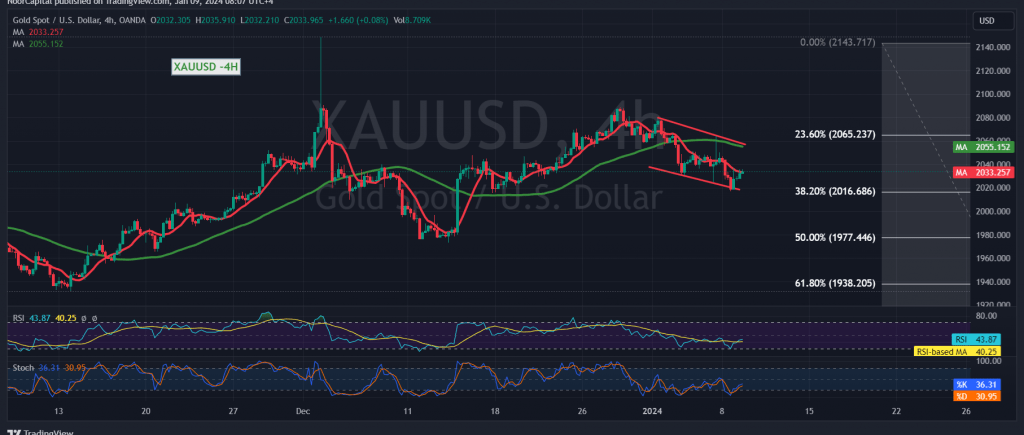
Gold prices recently touched the designated support level, established at the 2016 price, reaching a low of $2016 per ounce. The technical analysis indicates a subsequent upward rebound following this contact with the robust 2016 support level, prompting a retest of the 2040 resistance level.
Examining the 4-hour time frame chart, the price appears to be consolidating below 2047, and more broadly, beneath the primary resistance for the current trading levels, situated at 2065 (Fibonacci retracement 23.60%). Notably, negative signals have emerged on the Stochastic indicator, influenced by the downward pressure from the simple moving averages.
In the absence of a decisive move above 2047 in intraday trading, the prevailing expectation is a continuation of the downward trend during the current trading session. Confirmation of breaching the 2016 correction of 38.20% is anticipated to trigger a substantial downward wave, with initial targets at 2001 and an extension towards 1987.
Conversely, if gold prices manage to consolidate above 2047, confirmed by the closing of at least a one-hour candle, this could lead to a retest of 2065 before determining the subsequent price direction.
It is crucial to note a high level of risk, particularly given the ongoing geopolitical tensions, which may result in heightened price volatility. Investors are advised to exercise caution in light of these circumstances.
Note: Trading on CFDs involves risks. Therefore, all scenarios may be possible. This article is not a recommendation to buy or sell but rather an explanatory reading of the price movement on the chart.
| S1: |