
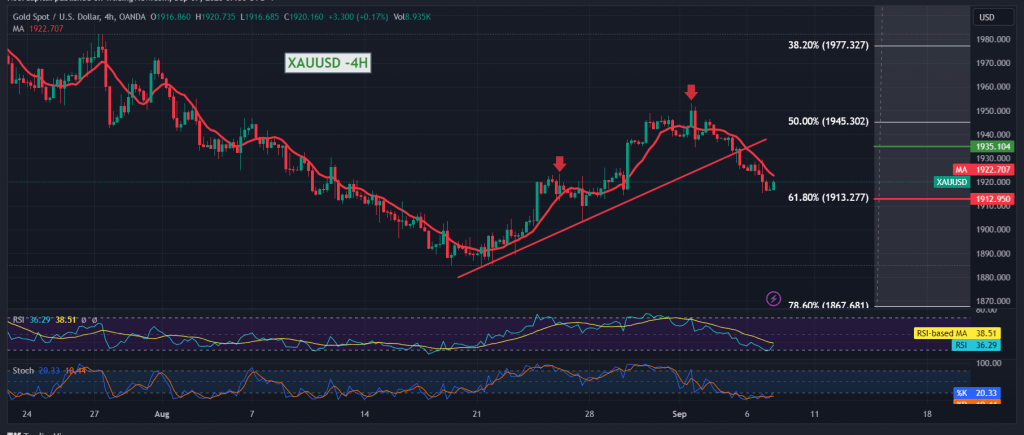
Gold prices continue due to the rise in the US dollar, heading towards touching the first target expected to be achieved during the previous technical report at 1920, approaching by a few points from the official station of 1913, only to record the lowest of $1,915 per ounce.
Technically, by looking at the 240-minute time frame chart, we find that the simple moving averages continue to exert negative pressure on the price from above, and the 50-day average meets around the 1935 resistance level and adds more strength to it, in addition to the Relative Strength Index continuing to defend the downward trend.
Therefore, we maintain our negative expectations, continuing towards the rest, targeting 1913 Fibonacci correction 61.80%, the next official station, and we must pay close attention that the decline below the mentioned level extends the losses, so we are waiting for 1905/1907, and the losses may extend later to visit 1899.
Price consolidation above 1935 with the closing of at least an hour above it invalidates the activation of the proposed scenario. We witness a trading session in positive areas to retest the 1945 50.0% correction.
Note: Today we are awaiting statistics on economic data with a high impact on the American economy, “the ISM Services Purchasing Managers Index,” and we may witness a high price fluctuation before the news is released.
Note: Trading on CFDs involves risks. Therefore, all scenarios may be possible. This article is not a recommendation to buy or sell but rather an explanatory reading of the price movement on the chart.
| S1: |