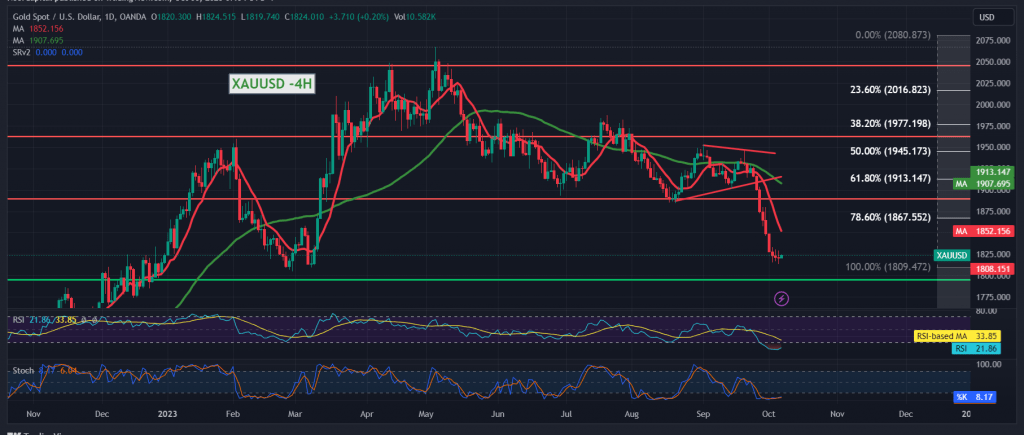
For the second session in a row, gold trading is limited from the bottom above the recently recorded low at 1815 and from the top below the 1830 resistance level without any significant change.
Technically, by looking at the 4-hour time frame chart, we find that positive crossover signals are beginning to appear on the Stochastic indicator. On the other hand, momentum is still declining significantly.
We prefer to monitor price behavior during the coming hours to preserve what was achieved during this week’s trading, and until we obtain a signal confirming the upcoming intraday trend, we are facing one of the following scenarios:
The price’s cohesion and stability above the resistance of 1830/1831 may motivate the price to reduce losses and achieve temporary gains targeting 1840/1838, which may extend later to visit 1847 before determining the next price destination, while failure to break 1830 with the return of trading stability below 1815. From here, the official bearish trend returns to control. On gold prices, we will be waiting for 1809 and 1806, and the losses may extend later towards 1795 and 1790, and the losses of the downward wave may extend towards 1780.
Note: Today, we are awaiting high-impact economic data issued by the American economy, “US jobs data (NFP), average wages and unemployment rates, and we may witness high price fluctuation when the news is released.
Note: Trading on CFDs involves risks. Therefore, all scenarios may be possible. This article is not a recommendation to buy or sell but rather an explanatory reading of the price movement on the chart.
| S1: |
 Noor Trends News, Technical Analysis, Educational Tools and Recommendations

