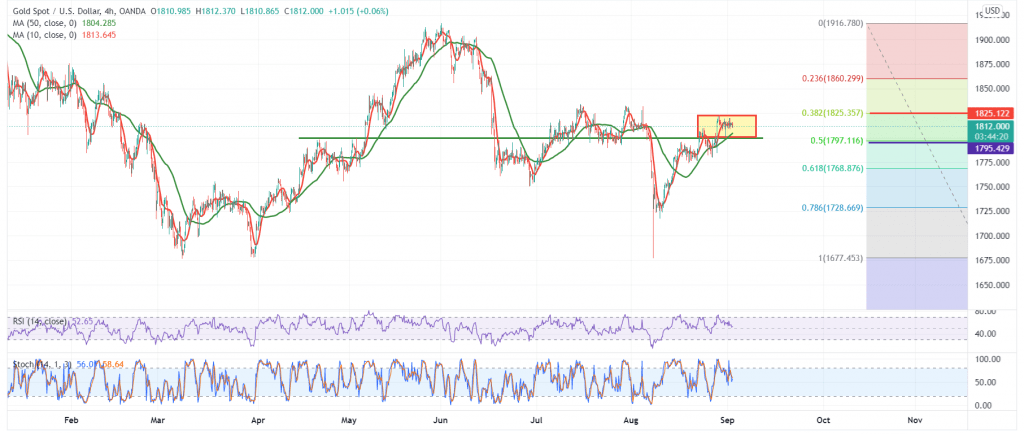
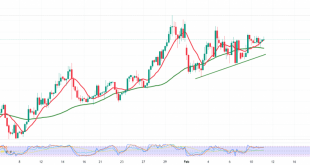
Gold prices are witnessing sideways trading in a narrow range that tends to be positive, gradually approaching the pivotal resistance level of 1823, which was previously referred to as the key to continuing the bullish trend, recording a high of 1820.
Technically, by looking at the 4-hour chart, we find the 50-day moving average that supports the bullish curve in prices and the stability of trading in general above the pivotal support level 1799 represented by the 50.0% Fibonacci correction.
On the other hand, we find the price is stable below 1823, unable to breach it until now, accompanied by the RSI losing the bullish momentum on the short time frames.
Therefore, with the continuation of the fluctuation in a narrow range, in addition to the conflicting technical signals, we will stand on the sidelines to obtain a high-quality deal to be in front of one of the following scenarios:
Activating long positions depends on the stability of trading above 1799, as we need to witness a clear breach of the 1825 level to motivate the price to visit 1830 and 1835.
Activating short positions requires breaking and settle below 1799, which puts the price under negative pressure targeting 1794 and 1782.
| S1: 1806.00 | R1: 1818.00 |
| S2: 1799.00 | R2: 1825.00 |
| S3: 1794.00 | R3: 1830.00 |
 Noor Trends News, Technical Analysis, Educational Tools and Recommendations

