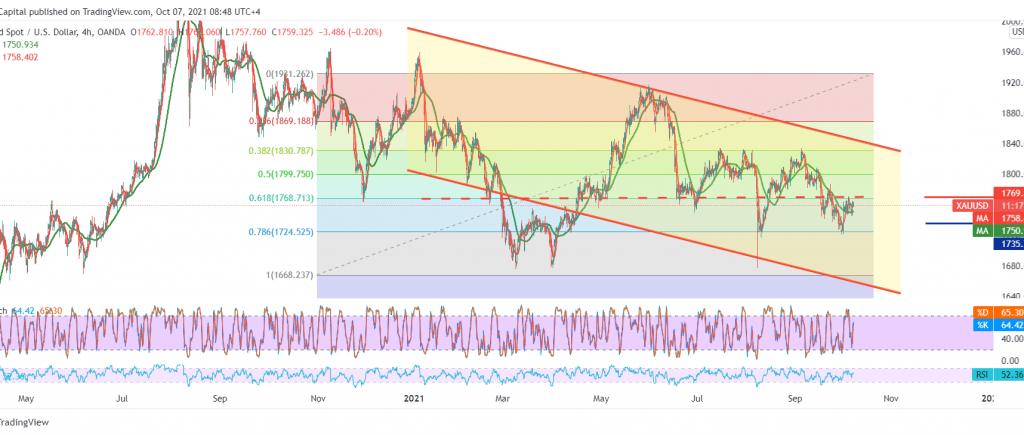
Gold prices managed to touch the first target at 1746, to return to the bullish rebound, benefiting from the support level, close to retesting 1768, recording the highest of 1765.
Today’s technical aspect indicates fluctuation within a sideways range between resistance level 1768, the 61.80% Fibonacci correction, and support level 1747. By looking at the chart, we notice the continuation of the negative signals coming from the stochastic indicator, as well as the stability of trading below the pivotal resistance 1768.
Next, the chances of returning the bearish bias still exist, knowing that intraday trading below 1752 facilitates the task required to visit 1747 and 1735 respectively, knowing that breaking the last level constitutes a strong negative pressure factor that opens the way for gold to achieve more losses extending towards 1727/1722 initially.
The bearish scenario depends on the stability of trading below 1768, 61.80% correction, and in general below 1770, because price stability above 1770 negates the attempts to retreat, and we will witness a temporary bullish path with an initial target around 1776 than 1781.
Note: the level of risk is high.
| S1: 1747.00 | R1: 1768.00 |
| S2: 1735.00 | R2: 1776.00 |
| S3: 1727.00 | R3: 1787.00 |