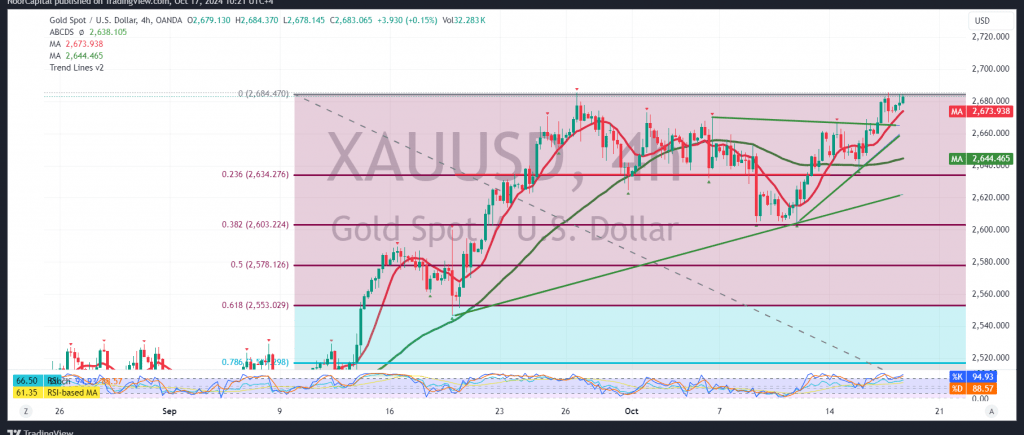
Gold prices are currently hovering around the historical peak of $2685 per ounce but have not yet managed to break through this level, leading to some declines during the previous trading session.
Technical Analysis: The simple moving averages continue to support the possibility of an upward move, with the 14-day momentum indicator suggesting the completion of the uptrend after stabilizing above $2664. However, as long as trading remains below $2685, the possibility of a downward correction is more likely, targeting $2664. A break below this level could open the way to retest the main support at $2635, which aligns with the 23.60% Fibonacci retracement.
On the upside, a confirmed break above $2685 could propel gold prices to new highs, targeting $2691 and $2700 initially.
Warnings:
- High-impact economic data: Anticipated releases from the European Central Bank (interest rates, monetary policy statement, and ECB President’s press conference) and key U.S. data (retail sales and unemployment benefits) could cause significant volatility in the market.
- Risk is elevated: Ongoing geopolitical tensions increase uncertainty, making all market scenarios possible.
Disclaimer: Trading in CFDs involves risks, and all scenarios are possible. This analysis is not investment advice but rather an interpretation of the current technical landscape for gold.
| S1: |
 Noor Trends News, Technical Analysis, Educational Tools and Recommendations

