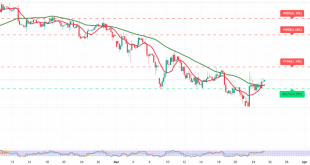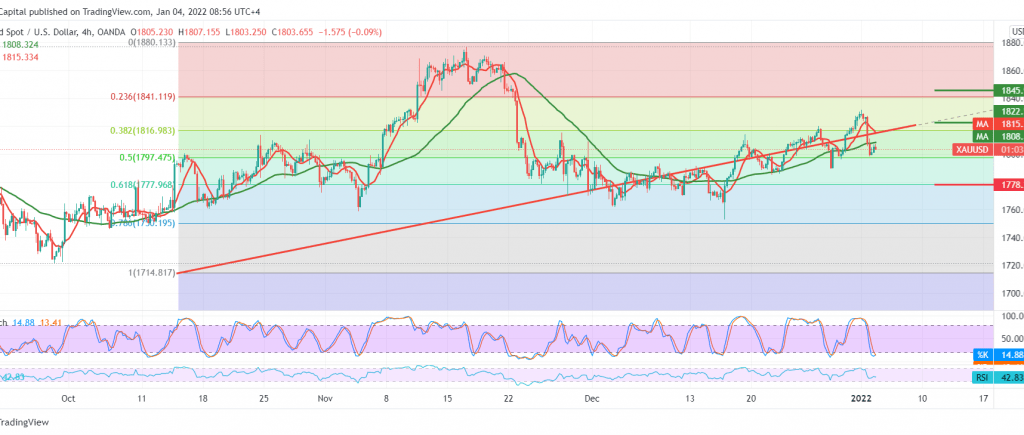
The yellow metal prices declined noticeably yesterday, after it recorded the highest level of $ 1831 per ounce, to find a strong resistance level around the mentioned level, which forced it to retest the pivotal support level at 1797.
On the technical side today, and by looking at the 240-minute chart, the current moves are witnessing stability below 1815 accompanied by the negative pressure of the simple moving averages on the price from above.
We tend to the negativity, but we prefer to wait until the confirmation of the break of 1797 represented by the 50.0% Fibonacci correction, which means the key to protecting the bullish trend, and breaking it leads the price to trade in the red areas to target 1777 first target, and then 1768 next stop.
From the top, the breach above 1823 cancels the suggested bearish scenario, and gold recovers to resume the official bullish trend with a target of 1845/1843.
| S1: 1790.00 | R1: 1823.00 |
| S2: 1777.00 | R2: 1843.00 |
| S3: 1757.00 | R3: 1856.00 |