
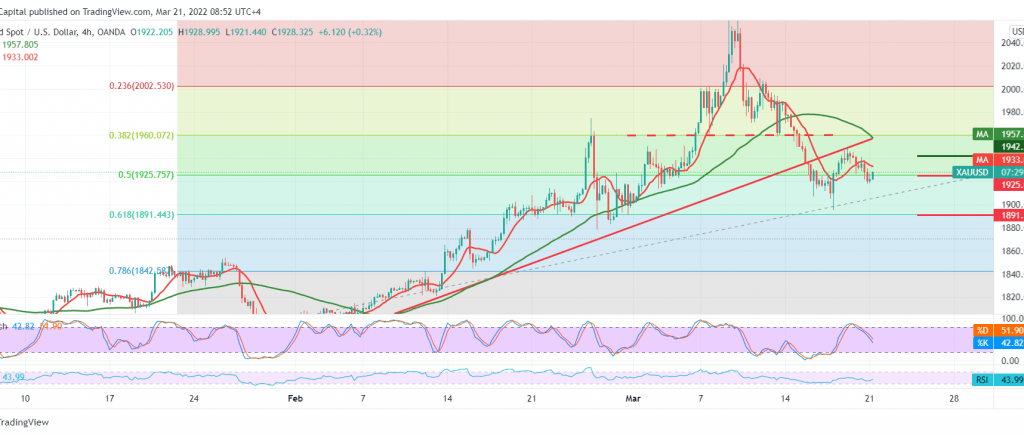
The current moves of gold are witnessing a bearish slope, but it is still limited, as the recent moves settle below the minor resistance level at 1936.
Technically, and by looking at the chart with a 240-minute chart, we notice the price stability below the 50-day moving average, which continues to pressure the price from above and the stochastic losing bullish momentum gradually.
Despite the technical factors that support the possibility of a drop, we prefer to confirm the breach of the 1925 support, 50.0% Fibonacci correction as shown on the chart, which represents the key to protecting the bullish trend, knowing that breaking the mentioned level may enhance the chances of a decline to visit 1915 and 1903 on The series as next price stations, its targets may extend later towards 1891, a correction of 61.80%.
Consolidation above 1942 might lead gold to regain the bullish path, opening the door to retest the 1960 level with a 38.20% correction.
Note: Trading on CFDs involves risks. Therefore, all scenarios may be possible. This article is not a recommendation to buy or sell but rather an explanatory reading of the price movement on the chart.
| S1: |