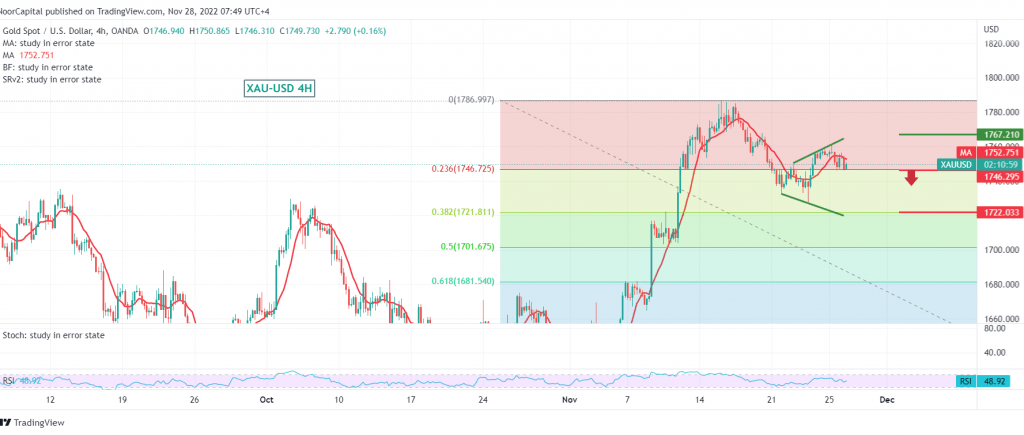
A limited bearish bias dominated gold’s movements last Friday, aiming to retest the support floor published during the previous analysis at 1745, trying to stabilize above it.
Technically, we tend to be positive, but with caution, depending on the stability of daily trading above the 1745 support level at 23.60% Fibonacci correction, as shown on the 240-minute chart, to target 1758 and 1767, respectively, taking into consideration that the official target is 1777 unless we witness a clear break of the support mentioned above.
A decline below 1745 leads gold prices to resume the bearish corrective path, waiting for an ounce of gold around 1737 and 1728 dollars, respectively.
Note: Trading on CFDs involves risks. Therefore, all scenarios may be possible. This article is not a recommendation to buy or sell but rather an explanatory reading of the price movement on the chart.
| S1: |
 Noor Trends News, Technical Analysis, Educational Tools and Recommendations

