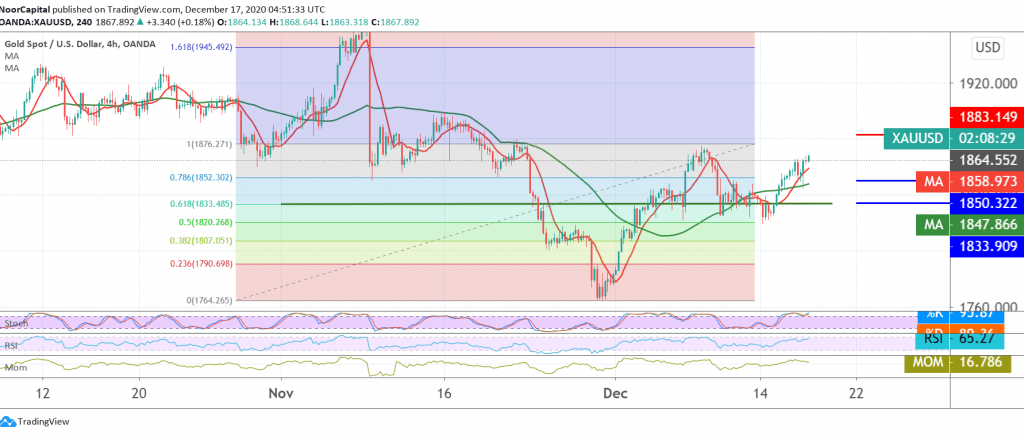
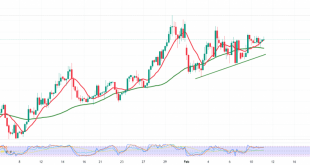
Mixed trades dominated gold prices, but trading tended to be positive, heading to touch the first target expected to be achieved during the previous analysis, located at the price of 1867, its highest level during the morning trading of the current session 1868.
On the technical side, we find gold succeeded in building a base on the support floor of 1833 Fibonacci 61.80%, and we find the RSI indicator is still defending the bullish tendency.
From here and the stability of intraday trading above the level of 1850, the bullish tendency is likely today, knowing that the confirmation of the breach of 1868 confirms the continuation of the gains towards 1875. Price behaviour must be carefully monitored around this level because crossing over it extends the gains, opening the way to the visit of 1882 / 1883.
From the bottom, the return of trading stability again below 1850 delays the bullish chances, but does not cancel it, and we may witness a re-test of 1833 before resuming the rally again. Pay close attention to observing the current directional keys from below 1833 and up from 1875.
| S1: 1850.00 | R1: 1875.00 |
| S2: 1833.00 | R2: 1883.00 |
| S3: 1827.00 | R3: 1899.00 |
 Noor Trends News, Technical Analysis, Educational Tools and Recommendations

