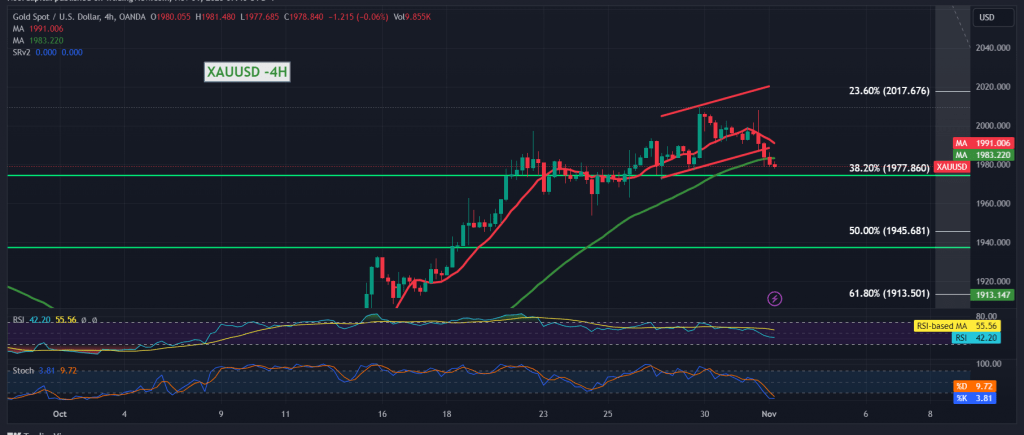
Gold prices followed the pattern outlined in the last technical report, successfully retesting the officially designated target at $1977. Today’s session began with continued pressure on this level.
Upon a detailed analysis of the 240-minute timeframe chart, it’s evident that the simple moving averages are exerting downward pressure on the price, and the Relative Strength Index is sending negative signals.
Our analysis leans towards a potential downward correction. However, a definitive and robust break below the critical support level of $1977 (represented by the 38.20% Fibonacci retracement) is crucial. Such a break would pave the way for a decline to $1967, the initial target, and then to $1958, the subsequent level. Further downward targets could extend to $1945, corresponding to the 50.0% correction level.
It’s important to note that consolidating the price above $1991 might bolster a recovery, potentially driving the price upwards to $1997 and $2007.
A word of caution: Today, we anticipate the release of high-impact economic data from the American economy, including changes in jobs in the private non-agricultural sector, the ISM manufacturing purchasing managers’ index, the Federal Reserve Committee statement, interest rates, and the press conference of the Federal Reserve chairman. Expect significant market volatility upon the release of this news.
Note: Trading on CFDs involves risks. Therefore, all scenarios may be possible. This article is not a recommendation to buy or sell but rather an explanatory reading of the price movement on the chart.
| S1: |
 Noor Trends News, Technical Analysis, Educational Tools and Recommendations

