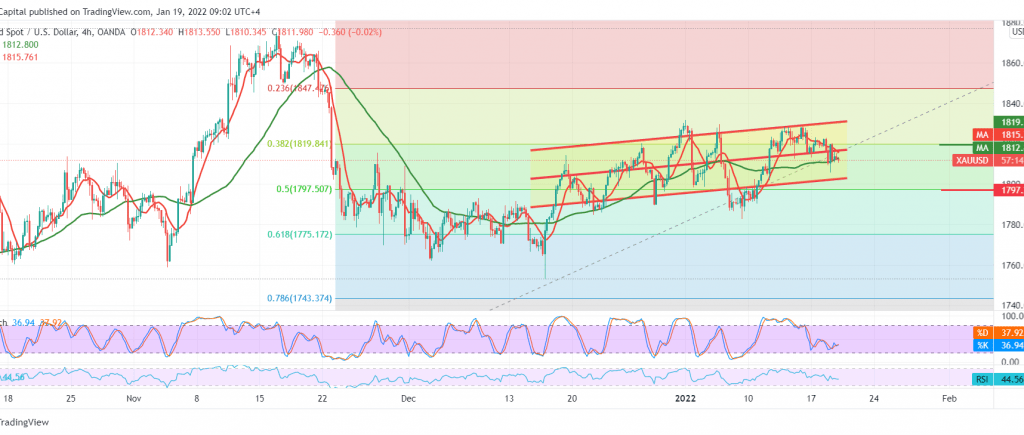
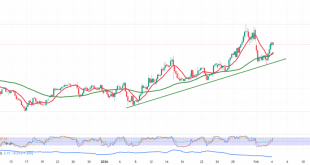
The movements of the yellow metal witnessed a negative trading session yesterday, and as a reminder, we indicated that we are waiting to confirm the breach of the 1810 level, and this increases the negativity to target 1803 so that gold approaches the required target, recording 1805
Technically, and carefully looking at the 240-minute chart, we notice the stability of trading below the 1820 resistance level represented by the 38.20% Fibonacci correction, in addition to the RSI gaining bearish momentum on the short intervals.
Therefore, The decline is the most likely scenario for 1797, 50.0% correction; any break should increase and accelerate the strength of the daily bearish trend, waiting for 1786.
Rising above the resistance level of 1820 might stop the expected bearish scenario and lead gold prices to retest 1829.
Note: CFD trading involves risks; all scenarios may occur.
| S1: 1803.00 | R1: 1820.00 |
| S2: 1795.00 | R2: 1829.00 |
| S3: 1786.00 | R3: 1837.00 |
 Noor Trends News, Technical Analysis, Educational Tools and Recommendations

