
Gold prices ended last week’s movements on a noticeable decline, after the issuance of better-than-expected US employment data, supporting the US dollar over gold’s interest.
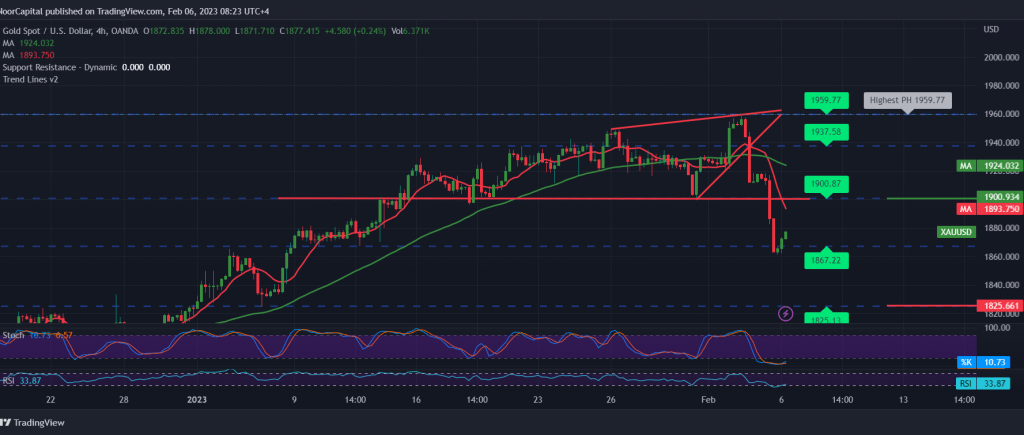
Technically, and with a closer look at the 240-minute chart, we find that gold prices are currently stabilizing below the strong demand area 1900, accompanied by the negative pressure of the 50-day simple moving average, which returned to pressure the price from above, in addition to the clear negative signals on the RSI on The time frame is 60 minutes.
Therefore, the chances of resuming the downside trend are still valid and effective, knowing that the decline below 1860 increases and accelerates the strength of the downside trend, paving the way for a visit to 1852, the first target, and after that 1825/1828 is an official expected station.
Consolidation above 1900 will immediately stop the completion of the downward path, and gold will recover again, waiting for touching 1910 and 1920, respectively.
Note: Stochastic is around overbought areas, and we may witness price fluctuations until we get the expected direction.
Note: Trading on CFDs involves risks. Therefore, all scenarios may be possible. This article is not a recommendation to buy or sell but rather an explanatory reading of the price movement on the chart.
| S1: |