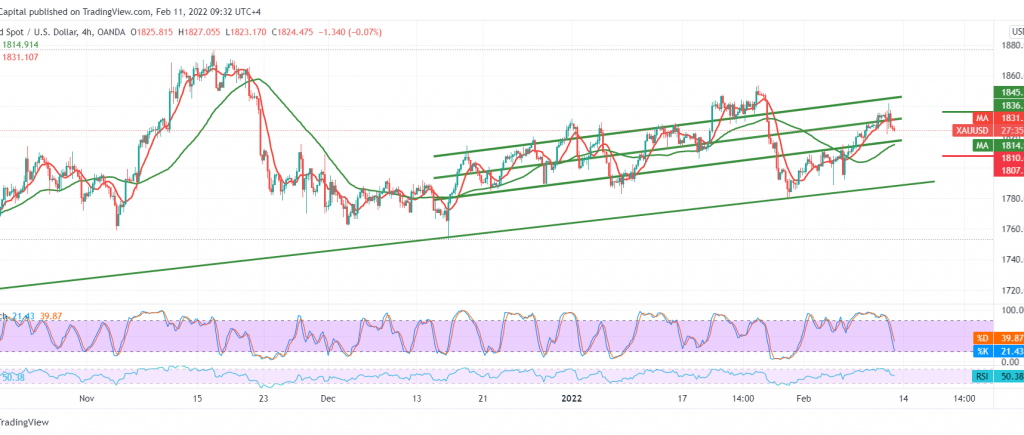
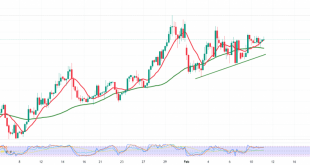
The yellow metal prices managed to touch its target at 1842, recording its highest level during the last session’s trading of 1842, returning to the negativity again due to hitting the resistance level of 1842 represented by the first bullish target.
Technically, by looking at the 4-hour chart, we notice trading stability below the 1832 resistance level. But, most importantly, the strength below 1836, as we find that the RSI started sending negative messages signals on the short time frames.
There may be a possibility to visit 1816, considering that the breach below the mentioned level may extend gold losses to be 1808 as the next stop, extending its targets towards the 1797 buying area.
To remind that the bearish tendency requires trading stability below 1836 and consolidation above it again, which may lead gold prices to recover towards 1848 and 1852.
Note: the risk level may be high today.
Note: Trading on CFDs involves risks. Therefore, all scenarios may be possible. This article is not a recommendation to buy or sell but rather an explanatory reading of the price movement on the chart.
| S1: 1816.00 | R1: 1836.00 |
| S2: 1808.00 | R2: 1848.00 |
| S3: 1796.00 | R3: 1856.00 |
 Noor Trends News, Technical Analysis, Educational Tools and Recommendations

